
Genome sequencing of pediatric medulloblastoma links catastrophic DNA rearrangements with TP53 mutations

Tobias Rausch et al. Cell. .

Abstract

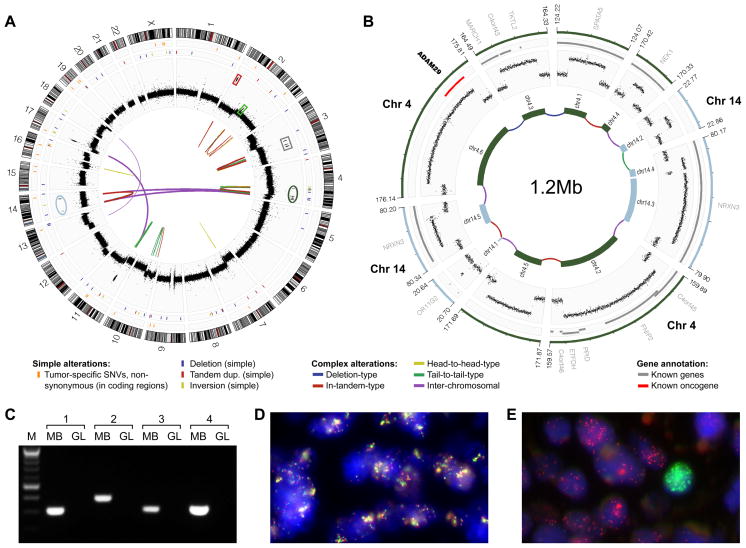
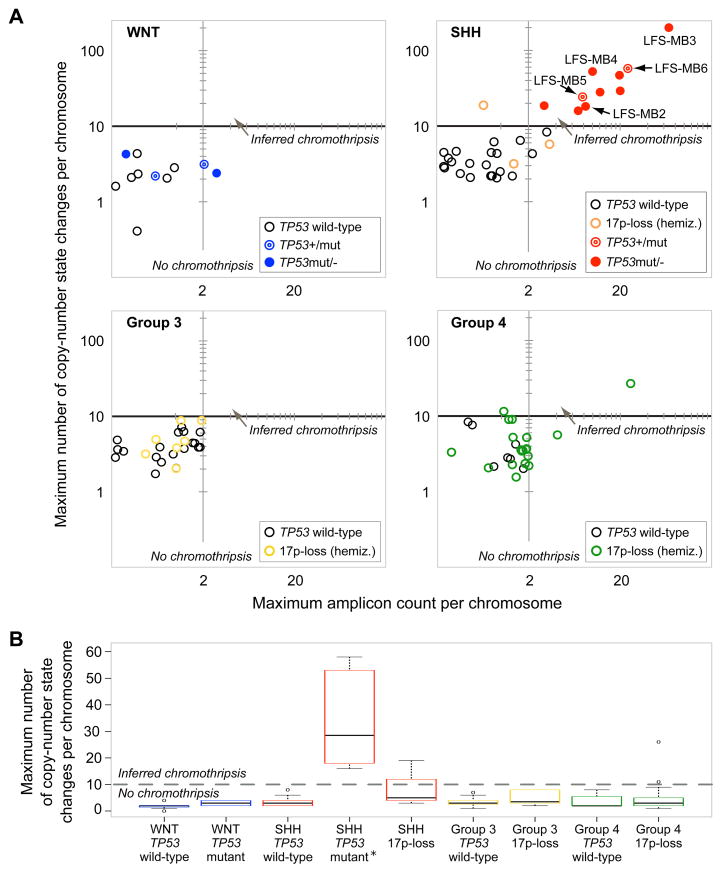
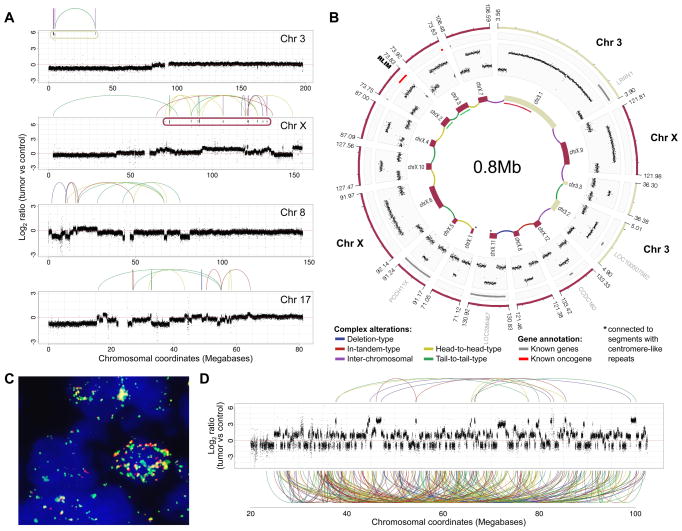
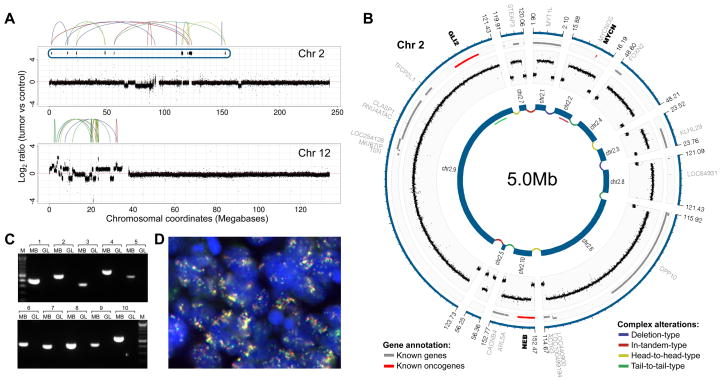
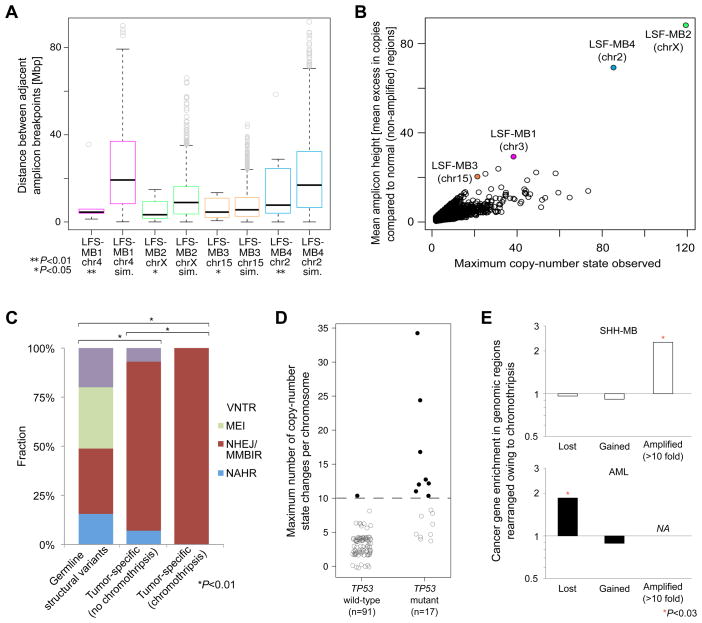
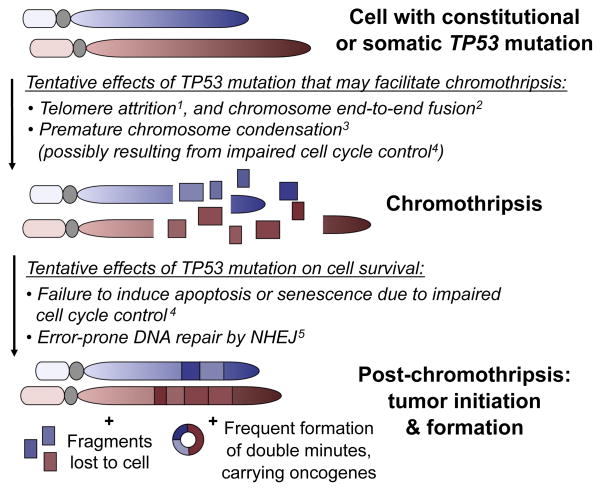
Genomic rearrangements are thought to occur progressively during tumor development. Recent findings, however, suggest an alternative mechanism, involving massive chromosome rearrangements in a one-step catastrophic event termed chromothripsis. We report the whole-genome sequencing-based analysis of a Sonic-Hedgehog medulloblastoma (SHH-MB) brain tumor from a patient with a germline TP53 mutation (Li-Fraumeni syndrome), uncovering massive, complex chromosome rearrangements. Integrating TP53 status with microarray and deep sequencing-based DNA rearrangement data in additional patients reveals a striking association between TP53 mutation and chromothripsis in SHH-MBs. Analysis of additional tumor entities substantiates a link between TP53 mutation and chromothripsis, and indicates a context-specific role for p53 in catastrophic DNA rearrangements. Among these, we observed a strong association between somatic TP53 mutations and chromothripsis in acute myeloid leukemia. These findings connect p53 status and chromothripsis in specific tumor types, providing a genetic basis for understanding particularly aggressive subtypes of cancer.


Figures

Figure 1
Figure 1
Analysis of LFS-MB1 revealed catastrophic DNA rearrangements consistent with chromothripsis. (A) Genome-wide distribution of somatic DNA variants. Thin orange lines in outer-most panel are non-synonymous somatic SNVs; the next panel shows isolated genomic rearrangements. Read-depth plots (log2-ratio tumor vs. germline), indicating copy-number alterations, are in black. Connecting lines show complex large-scale (e.g., inter-chromosomal) rearrangements identified by paired-end mapping. (B) Inferred double minute chromosome structure (originating segments from chromosome 4 and 14 are highlighted in panel (A)). Genes are in gray (known cancer genes are in red). (C) PCR validation of inter-chromosomal rearrangements contributing to the inferred double minute chromosome. MB, medulloblastoma; GL, germline. (D) FISH validation of rearrangements contributing to double minute chromosome derived from chromosome 3 segments. Probes match to normally distal regions of chromosome 3 (RP11-553D4, red, and RP11-265F19, light green; see panel (A) and Figure S1). (E) Amplification of MYCN (red) and GLI2 (light green), not associated with chromothripsis (amplicon loci highlighted in panel (A) with red and light green boxes), was observed in distinct subpopulations of cells.
Figure 2
Figure 2
SNP array copy-number profiles reveal a link between TP53 mutation and chromothripsis in SHH-MB. (A) Maximum number of copy-number state changes, and amplicon counts, on most strongly affected (rearranged) chromosomes. Abbreviation: hemiz., hemizygous. Further details are available as Data S1. Random noise was added (i.e., addition, or subtraction, of <0.5 copies) for visualization purposes. (B) Boxplot with maximum copy-number state changes on most strongly affected chromosome for different tumor subtypes and TP53 statuses. *An outlying point observed in LFS-MB3 (>200 copy-number state changes) was omitted for visualization purposes.
Figure 3
Figure 3
Verification of chromothripsis in LFS-MB2 and LFS-MB3 by whole-genome sequencing. (A) Copy-number profiles in LFS-MB2. (B) Predicted double minute chromosome structure. *Segments connected to centromere-like repeat sequences. (C) FISH confirming co-localization of fragments from chromosomes 3 and X in LFS-MB2 (RP11-245A6, green and CTD-2530H13, red); positions of FISH probes are shown on the inner-most circle of panel (B)). PCR experiments also confirmed this co-localization (see Figure S2). (D) Read-depth plot showing chromosome 15 rearrangements resulting from chromothripsis in LFS-MB3. Links connecting amplified regions are displayed on top (other links involving rearranged segments are displayed at the bottom).
Figure 4
Figure 4
Verification of chromothripsis in LFS-MB4. (A) DNA copy-number profiles. (B) Inferred double minute chromosome structure with SHH pathway members MYCN and GLI2. (C) PCR confirms juxtaposition of segments shown in panel (B). (D) FISH verifying co-localization of MYCN (red) and GLI2 (green).
Figure 5
Figure 5
Analysis of chromothripsis-associated DNA rearrangements in SHH-MB and AML. (A) Topographical clustering of amplified regions rearranged by chromothripsis. Sim., simulated amplicon distances (P-values are based on 1000 permutations). (B) Simulations of progressive rearrangements segregate from the actual data in terms of mean excess in copy-number compared to unaffected regions. (C) Rearrangement formation mechanisms analysis. Polymorphic genomic structural variants detected in the germline are shown for comparison. P-values, indicating significant differences between the distributions of inferred formation mechanisms, are based on Chi-square tests. VNTR, expansion or shrinkage of regions with variable number of tandem repeats; MEI, mobile element insertions; NAHR, non-allelic homologous recombination (other abbreviations: see main text). (D) Somatically acquired TP53 mutations are linked with the occurrence of chromothripsis in AML. Black filled circles: AMLs with chromothripsis. Gray open circles: AMLs without chromothripsis. Example copy-number profiles are available as Data S2, and a detailed summary of the AML data is in Table S5. (E) Cancer gene enrichment in association with chromothripsis in SHH-MBs, analyzed by deep sequencing, and AMLs, analyzed by SNP arrays. Regions hemizygously deleted (‘lost’), gained, and highly (>10-fold) amplified as a consequence of chromothripsis were separately analyzed. No genes displayed high-level amplification in AML in association with chromothripsis (‘NA’). ‘*’significant based on Fisher’s exact test.
Figure 6
Figure 6
New model linking TP53 mutation status to catastrophic DNA rearrangements. Related references: 1Tabori et al. (2007); 2Tusell et al. (2010); 3Meyerson and Pellman (2011); 4Vogelstein et al. (2000); 5Dahm-Daphi et al. (2005).

Comment in

  • Shattered details.
    Burgess DJ. Burgess DJ. Nat Rev Cancer. 2012 Feb 2;12(3):152. doi: 10.1038/nrc3228. Nat Rev Cancer. 2012. PMID: 22298192 No abstract available.
  • Genomic instability: Shattered details.
    Burgess DJ. Burgess DJ. Nat Rev Genet. 2012 Feb 2;13(3):150. doi: 10.1038/nrg3177. Nat Rev Genet. 2012. PMID: 22298233 No abstract available.

References

    1. Abyzov A, Urban AE, Snyder M, Gerstein M. CNVnator: an approach to discover, genotype, and characterize typical and atypical CNVs from family and population genome sequencing. Genome Res. 2011;21:974–984. - PMC - PubMed
    1. Bühren J, Christoph AH, Buslei R, Albrecht S, Wiestler OD, Pietsch T. Expression of the neurotrophin receptor p75NTR in medulloblastomas is correlated with distinct histological and clinical features: evidence for a medulloblastoma subtype derived from the external granule cell layer. J Neuropathol Exp Neurol. 2000;59:229–240. - PubMed
    1. Buonamici S, Williams J, Morrissey M, Wang A, Guo R, Vattay A, Hsiao K, Yuan J, Green J, Ospina B, et al. Interfering with resistance to smoothened antagonists by inhibition of the PI3K pathway in medulloblastoma. Sci Transl Med. 2010;2:51ra70. - PMC - PubMed
    1. Chiang DY, Getz G, Jaffe DB, O’Kelly MJ, Zhao X, Carter SL, Russ C, Nusbaum C, Meyerson M, Lander ES. High-resolution mapping of copy-number alterations with massively parallel sequencing. Nat Methods. 2009;6:99–103. - PMC - PubMed
    1. Cho YJ, Tsherniak A, Tamayo P, Santagata S, Ligon A, Greulich H, Berhoukim R, Amani V, Goumnerova L, Eberhart CG, et al. Integrative genomic analysis of medulloblastoma identifies a molecular subgroup that drives poor clinical outcome. J Clin Oncol. 2011;29:1424–1430. - PMC - PubMed

Publication types

Substances