. 2012 Jan 20;148(1-2):175-88.
doi: 10.1016/j.cell.2011.10.050.

Membrane tension maintains cell polarity by confining signals to the leading edge during neutrophil migration

Affiliations

Membrane tension maintains cell polarity by confining signals to the leading edge during neutrophil migration

Andrew R Houk et al. Cell. .

Abstract

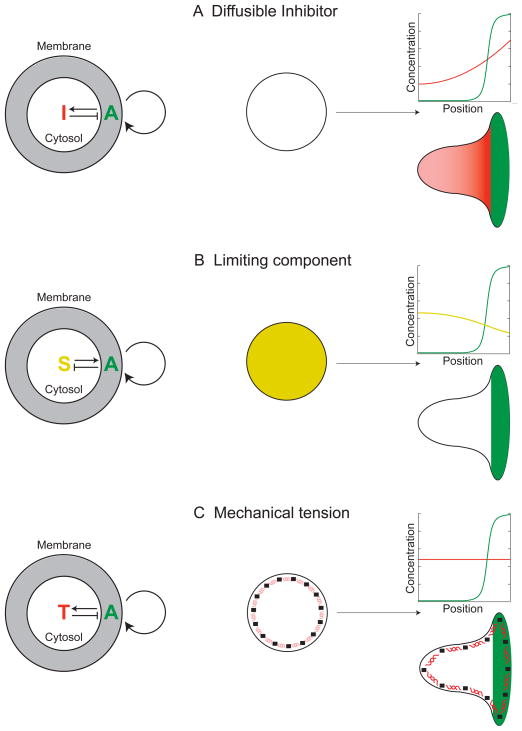
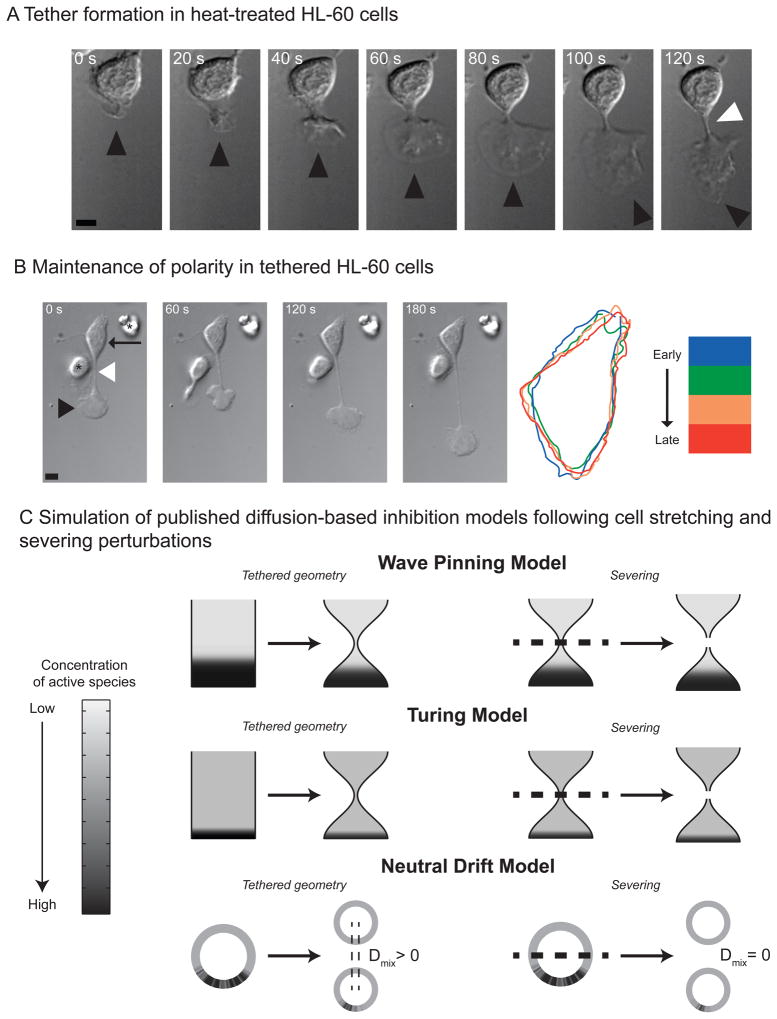
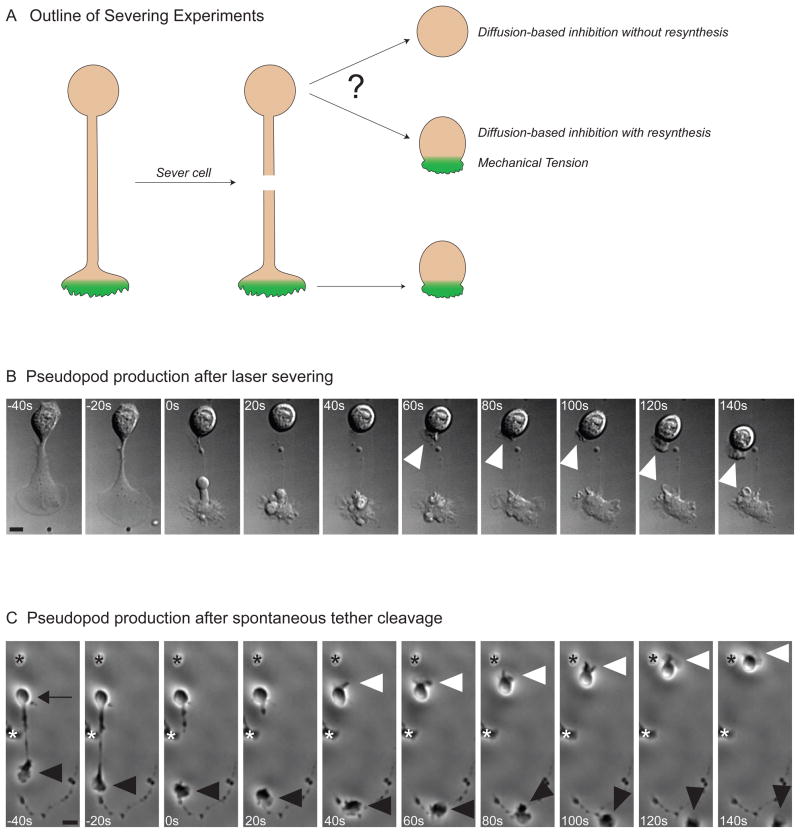
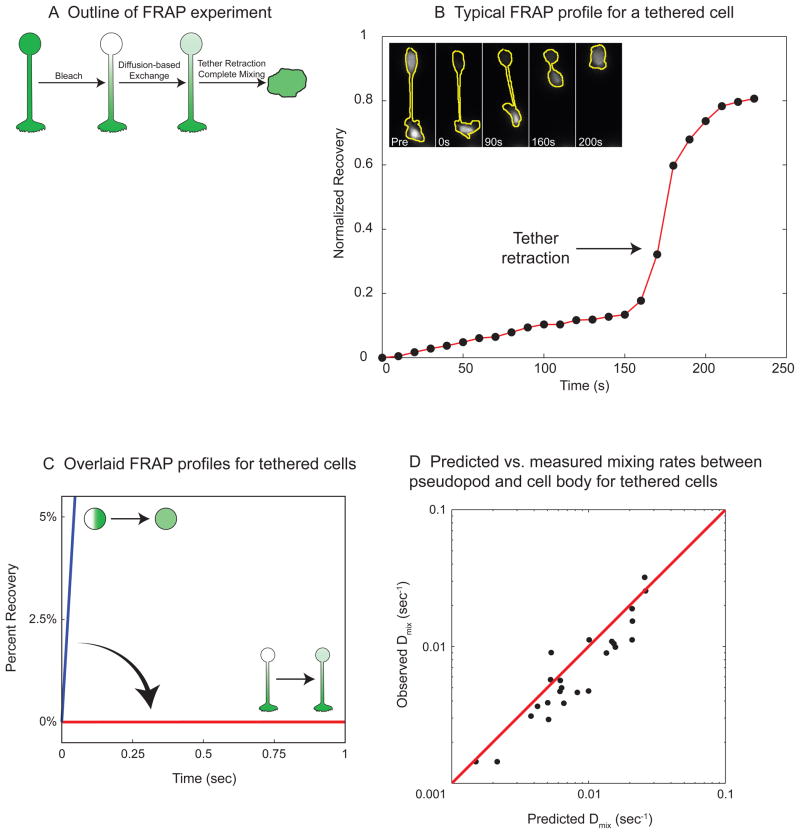
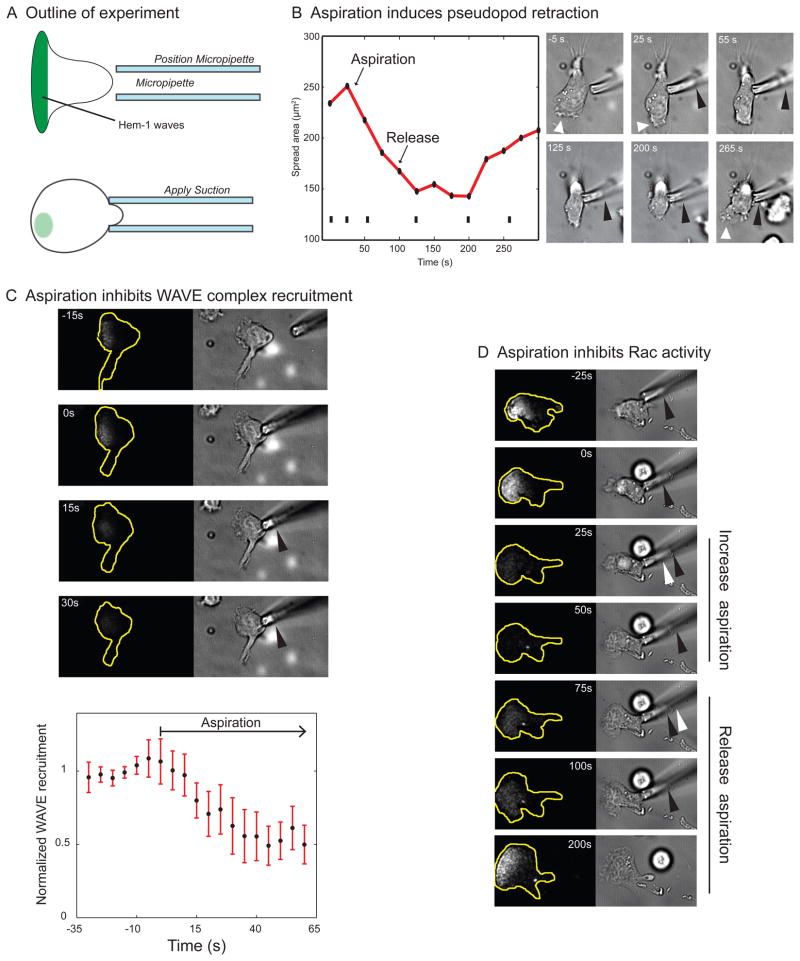
Little is known about how neutrophils and other cells establish a single zone of actin assembly during migration. A widespread assumption is that the leading edge prevents formation of additional fronts by generating long-range diffusible inhibitors or by sequestering essential polarity components. We use morphological perturbations, cell-severing experiments, and computational simulations to show that diffusion-based mechanisms are not sufficient for long-range inhibition by the pseudopod. Instead, plasma membrane tension could serve as a long-range inhibitor in neutrophils. We find that membrane tension doubles during leading-edge protrusion, and increasing tension is sufficient for long-range inhibition of actin assembly and Rac activation. Furthermore, reducing membrane tension causes uniform actin assembly. We suggest that tension, rather than diffusible molecules generated or sequestered at the leading edge, is the dominant source of long-range inhibition that constrains the spread of the existing front and prevents the formation of secondary fronts.


Figures

Figure 1
Figure 1. Conceptual mechanisms for long-range inhibition
A) Diffusible Inhibitor. An autocatalytic activator (A, green) produces an inhibitory molecule (I, red) that diffuses throughout the cytoplasm to act as a long-range inhibitor of leading edge formation. B) Limiting Component. An autocatalytic activator in the front inhibits activation elsewhere by consuming essential substrates (S, gold) of the positive feedback loop, rather than generating a diffusible inhibitor (as in (A)). C) Mechanical Tension. Protrusion at the leading edge generates mechanical tension (T, depicted as red springs) in either the plasma membrane or the underlying cytoskeleton. This tension acts as a long-range inhibitor of protrusion.
Figure 2
Figure 2. Maintenance of polarity in tethered cells
A) Tether formation in heat-treated HL-60 cells. The cell initially forms a pseudopod (black arrowhead). The pseudopod crawls away from the fixed cell body, causing a tether (white arrowhead) to form between them. The scale bar is 5 microns. B) Maintenance of polarity in tethered HL-60 cells. Left: The cell body (black arrow) remains completely fixed as the pseudopod (black arrowhead) migrates a significant distance. The asterisk in the first frame denotes a neighboring cell that lacks a tether. Right: cell outlines from successive time points are depicted in blue, green, orange, and red, respectively. The morphology of the cell body stays constant over the 250 second observation time in 91% of the uncut cells (N = 27). The scale bar is 5 microns. C) Simulation of published diffusion-based inhibition models following cell stretching and severing perturbations. The top, middle and bottom panels depict simulation results of a wave pinning model (top), Turing model (middle), and neutral drift model (bottom) following cell stretching or severing. The concentration of the activator species (u) is represented as grayscale with black being highest concentration. In the left panels, spherical or cylindrical cells were allowed to develop polarized signals. We simulated the subsequent time evolution of this polarized signaling distribution in cells that were stretched into dumb-bell geometries, similar to our experimental tethers (Figure 2). In the right panels, the signals in spherical or cylindrical cells were polarized as before. We simulated the time evolution of the signals in cells that were severed into two equal halves. Steady state distributions of membrane-bound activators for all three models are shown.
Figure 3
Figure 3. Cells generate a new pseudopod after severing
A) Outline of severing experiments. Following cell polarization, the pseudopod is removed, and the behavior of the cell body is observed. If the pseudopod had sequestered a non-regenerating limiting component required for polarization, the cell body should not have the material to reanimate. Reanimation of the cell body following severing of the pseudopod would be consistent with short-lived inhibitor generated at the leading edge. This short-lived inhibitor could be due to mechanical tension, a rapidly synthesized limiting component, or a diffusible inhibitor with a short half-life. B) Pseudopod production after laser severing. DIC images showing a tethered HL-60 that is severed with a laser beam just before 0 seconds. Following severing, the previously quiescent cell body generates a new pseudopod (white arrowhead). The cell body makes a pseudopod after severing in 47% of cells (N = 36). The scale bar is 2.5 microns. C) Pseudopod production after spontaneous tether cleavage. Phase images of a cell whose pseudopod (black arrowhead) spontaneously breaks free from the cell body (black arrow) at 0 seconds. The cell body makes a new pseudopod within 50 seconds of severing (white arrowhead) and begins to migrate. The asterisks denote neighboring cells. There is significant reanimation of the cell body following spontaneous tether cleavage in 26% of cells (N = 62). The scale bar is 10 microns.
Figure 4
Figure 4. The tethered morphology dramatically attenuates diffusion
A) Outline of FRAP (Fluorescence Recovery After Photobleaching) experiment. A GFP-expressing HL-60 cell is heated to generate a tethered pseudopod. We bleached the GFP in the cell body, and the recovery in the cell body was measured to monitor diffusion-based mixing through the tether. Retraction of the pseudopod causes the contents of the cell body and the pseudopod to mix completely. B) Typical FRAP profile for a tethered cell. The graph shows the normalized fluorescence recovery due to diffusion for the cell whose GFP fluorescence is shown in the inset images (with cell outlines in yellow). There is slow linear recovery until 160 sec, when the tethered pseudopod retracts, and the GFP from the pseudopod rapidly mixes with the cell body. C) Overlaid FRAP profiles for tethered cells. The measured fluorescence recoveries for all of the tethered cells during the first second after bleaching are overlaid in red. The expected initial fluorescence recovery for a non-tethered spherical cell (mixing rate constant = 1.2/sec) is shown in blue. D) Predicted vs. measured mixing rates between pseudopod and cell body for tethered cells. Each black dot represents the diffusion-based mixing rate constant for an individual photobleached cell. The y coordinate for each cell is the experimentally measured mixing rate constant (Dmix, obs). The x coordinate for each cell is the predicted mixing rate constant using the formula: Dmix,predDGFP=VtetherL2Vcell; where Dmix,pred is the predicted mixing rate constant; DGFP is the known diffusion coefficient of GFP in cytoplasm (27μm2/s, (Swaminathan et al., 1997)); L is the tether length; and Vcell and Vtether are the volumes of the cell and the tether, respectively. The values L, Vcell and Vtether were measured for each cell from brightfield images. The predicted mixing rates correlate with the measured values (R2 = 0.8, N=24, red line is y = x). The tethered geometry reduces mixing rate by 134 - 4472 fold for all of the cells in the experiment.
Figure 5
Figure 5. Membrane tension increases during protrusion
A) Schematic outline of membrane tension measurement experiment. The tension in the plasma membrane can be measured by pulling a thin tube of membrane from the cell surface with an adhesive polystyrene bead in an optical trap. Increases in membrane tension result in higher pulling forces on the bead. We hypothesized that cell spreading, induced by uniform fMLP addition, should cause the membrane tension to increase. As a control, we flow in buffer, which does not induce spreading and should not increase membrane tension. B) Pulling force over time for a representative cell. For primary human neutrophils, the tube was first pulled to a length of ~2 microns (pull 1, arrow, light green bar) and held there briefly (hold 1, light blue bar). The tube was then extended to a length of ~10 microns (pull 2, arrow, dark green bar) and held there (hold 2, dark blue bar) before fMLP (arrow) was flowed in. The colored bars denote the time period over which the forces were averaged for the graph in D; these regions were selected to avoid sudden force jumps. Addition of fMLP caused the cell to spread and the pulling force to increase dramatically (red bar). The inset graph shows the increase in spread area (green) and the increase in tether force (blue), both of which were normalized to the total area or force increase that occurred during the response. Brightfield images of the cell, with the outline superimposed in yellow, are shown below. The tether position, determined with a fluorescent membrane dye (DiI), is also superimposed in yellow. C) Pulling force over time for individual cells following buffer addition or fMLP stimulation. The left panel shows the force traces of tubes held at constant length as buffer is flowed through the chamber to control for the effects of flow on the force measurements. The right panel shows the force traces of tubes held at constant length as the cells were stimulated by flowing fMLP through the chamber. In both panels, flow begins at the beginning of each trace. D) Pulling force at different stages of the experiment. The graph shows the forces at different times during the experiment (denoted by the colored bars in B) for the eight fMLP-stimulated cells depicted in C. Each black dot represents the force measurement of an individual cell. The large and small maroon bars indicate mean force values and standard errors, respectively. After fMLP addition, the cell spreads and the force increases dramatically (p = 0.0006) and briefly plateaus (post-spread, red bar in B) before the tube detaches from the bead.
Figure 6
Figure 6. Increasing tension with aspiration reversibly inhibits leading edge protrusion and signaling
A) Outline of experiment. Schematic showing the predicted results of aspiration experiments for a long-range inhibitor based on cell tension. The deformation of the cell due to aspiration increases tension, which would be predicted to inhibit protrusion and reduce SCAR/WAVE complex recruitment. B) Aspiration induces pseudopod retraction. Aspiration of the trailing edge acts as a long-range inhibitor of protrusion. Left: a graph of the spread area over time during aspiration. The spread area decreases dramatically upon aspiration and then eventually rebounds after release. Tick marks indicate bright field frames shown at right. Right: brightfield images of the same cell. The tip of aspirated cytoplasm is shown with a black arrowhead. The pseudopod (white arrowhead) dies and retracts shortly after aspiration. When the aspirated cytoplasm is released, a new pseudopod forms with a delay of about 100 seconds. C) Aspiration inhibits SCAR/WAVE complex recruitment. Top: A crawling neutrophil expressing the SCAR/WAVE complex reporter Hem-1-YFP is shown before (−15s and 0s) and during micropipette aspiration. The black arrowhead in the brightfield image denotes the portion of the cell aspirated into the pipette. Increasing tension via aspiration inhibits SCAR/WAVE complex recruitment throughout the cell. Bottom: Quantitation of Hem-1-YFP recruitment during aspiration experiments (N = 10); aspiration begins at frame seven (arrow). D) Aspiration inhibits Rac activity. A crawling neutrophil expressing the Rac activation reporter PAK-PBD-YFP is shown. The fluorescence channel shows PAK-PBD-YFP visualized in TIRF mode. Each brightfield frame shows the portion of the cell aspirated into the pipette for the current (black arrowhead) and previous (white arrowhead) frames. Aspiration-mediated increases in cell tension result in a dramatic decrease in Rac activation in 85% of cells (N =27). Rac activation returns upon the release of aspiration pressure 65% of the time.
Figure 7
Figure 7. Membrane Tension Reduction Causes Expansion of Leading Edge Signaling
A) Blebbistatin treatment causes cellular elongation but no enhancement of leading edge signaling. Top: A crawling neutrophil expressing the SCAR/WAVE complex reporter Hem-1-YFP (visualized in TIRF mode, shown as a heat map) is shown before (−10s) and during (5s, 25s, 55s) application of blebbistatin, which reduces cytoskeletal tension but increases membrane tension. The cells become elongated, but SCAR/WAVE complex recruitment does not expand beyond the leading edge. SCAR/WAVE complex recruitment decreases at later time points, likely due to elongation-induced increases in membrane tension. Bottom: Brightfield images of the same cell to visualize morphology. B) Combination of hypertonic buffer and blebbistatin causes uniform SCAR/WAVE complex recruitment. Top: A blebbistatin-treated (100 μM) neutrophil expressing the SCAR/WAVE complex reporter Hem-1-YFP (visualized in TIRF mode, shown as a heat map) is shown before (−20s and −10s) and during (5s, 15s and 475s) application of hypertonic buffer (150mM sucrose + 100 μM blebbistatin), which reduces membrane tension. Reduction in membrane tension causes SCAR/WAVE complex recruitment throughout the cell. Bottom: Brightfield images of the same cell to visualize morphology. Note the uniform spreading between the 15s and 475s time points. C) Quantification of tension reduction effects on signaling. Quantitation of Hem-1-YFP recruitment during treatment with either hypertonic buffer + blebbistatin (red, N=24), hypertonic buffer alone (blue, N=28), or blebbistatin alone (green, N=12). The number of pixels containing Hem-1 signal were quantified at each time point (see Methods and Materials) and normalized to the pre-treatment signal.

Comment in

  • Neutrophils under tension.
    Afonso PV, Parent CA. Afonso PV, et al. Dev Cell. 2012 Feb 14;22(2):236-8. doi: 10.1016/j.devcel.2012.01.017. Dev Cell. 2012. PMID: 22340489 Free PMC article.

References

    1. Allen WE, Zicha D, Ridley AJ, Jones GE. A role for Cdc42 in macrophage chemotaxis. J Cell Biol. 1998;141:1147–1157. - PMC - PubMed
    1. Altschuler SJ, Angenent SB, Wang Y, Wu LF. On the spontaneous emergence of cell polarity. Nature. 2008;454:886–889. - PMC - PubMed
    1. Barnhart EL, Lee KC, Keren K, Mogilner A, Theriot JA. An adhesion-dependent switch between mechanisms that determine motile cell shape. PLoS Biol. 2011;9:e1001059. - PMC - PubMed
    1. Butty AC, Perrinjaquet N, Petit A, Jaquenoud M, Segall JE, Hofmann K, Zwahlen C, Peter M. A positive feedback loop stabilizes the guanine-nucleotide exchange factor Cdc24 at sites of polarization. Embo J. 2002;21:1565–1576. - PMC - PubMed
    1. Cai Y, Rossier O, Gauthier NC, Biais N, Fardin MA, Zhang X, Miller LW, Ladoux B, Cornish VW, Sheetz MP. Cytoskeletal coherence requires myosin-IIA contractility. J Cell Sci. 2010;123:413–423. - PMC - PubMed

Publication types