. 2012 Jan 20;148(1-2):201-12.
doi: 10.1016/j.cell.2011.10.051.

Endoplasmic reticulum PI(3)P lipid binding targets malaria proteins to the host cell

Affiliations

Endoplasmic reticulum PI(3)P lipid binding targets malaria proteins to the host cell

Souvik Bhattacharjee et al. Cell. .

Abstract

Hundreds of effector proteins of the human malaria parasite Plasmodium falciparum constitute a "secretome" carrying a host-targeting (HT) signal, which predicts their export from the intracellular pathogen into the surrounding erythrocyte. Cleavage of the HT signal by a parasite endoplasmic reticulum (ER) protease, plasmepsin V, is the proposed export mechanism. Here, we show that the HT signal facilitates export by recognition of the lipid phosphatidylinositol-3-phosphate (PI(3)P) in the ER, prior to and independent of protease action. Secretome HT signals, including those of major virulence determinants, bind PI(3)P with nanomolar affinity and amino acid specificities displayed by HT-mediated export. PI(3)P-enriched regions are detected within the parasite's ER and colocalize with endogenous HT signal on ER precursors, which also display high-affinity binding to PI(3)P. A related pathogenic oomycete's HT signal export is dependent on PI(3)P binding, without cleavage by plasmepsin V. Thus, PI(3)P in the ER functions in mechanisms of secretion and pathogenesis.


Figures

Figure 1
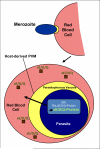
Figure 1. Schematic of intracellular infection of Plasmodium and targeting parasite proteins to the host erythrocyte
A human erythrocyte (pink) infected by P. falciparum (blue). Invasion by the extracellular merozoite stage leads to formation of a host derived PVM within which the parasite resides and proliferates. Proteins (brown squares) secreted by the parasite must cross the PVM to reach and mediate virulence and structural changes in the erythrocyte. A consensus motif of RxLxE/D/Q at the N-terminus of parasite proteins is proteolytically cleaved after the RxL in the ER, to generate proteins bearing xE/D/Q at their N terminus that are then exported from the ER to the erythrocyte.
Figure 2
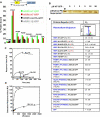
Figure 2. Lipid Binding Properties of HT Signals
(A) Summary of quantitative lipid binding specificity of PfHRPII: HT-GFP, HT-RFP, ALAYAGFP and YE-RFP, based on lipid pull down data shown in Figure S2. All proteins (recombinants purified from E. coli) contain the HT motif (RxLxE) and flanking sequences (that together comprise the vacuolar translocation sequence), as shown in the schematic. Sequence information is in Table S2. (B) Competition assay between HT-GFP and the p40-phox-PX domain. 5 μM p40-phox-PX was incubated with 1 mM PI(3)P containing vesicles and HT-GFP was added at increasing concentrations from 0–20 μM. After 20 min the supernatant fraction was resolved using SDS-PAGE following centrifugation. M indicates total protein loaded into each reaction. (C) SPR analysis demonstrates quantitative lipid binding of HT/RLLYE-GFP, ALLYE-GFP, RLAYE-GFP, and RLLYA-GFP for PI(3)P containing vesicles. 1 μM of each construct was injected over a POPC:POPE:PI(3)P (75:20:5) surface at 30 μl/min using POPC:POPE (80:20) as a control. The control response was subtracted from each active surface to yield the displayed sensorgrams. (D) Equilibrium SPR binding analysis of HT/RLLYE-GFP (open circles) and RLLYA-GFP (filled circles). To determine Kd values, Req values were plotted versus [P], and the Kd value was determined by a nonlinear least-squares analysis of the binding isotherm using the following equation: Req = Rmax/(1 + Kd/P0). For proteins with weak affinity, dilutions were made up to 10 μM to probe for lipid binding. If no binding was detected this allowed us to estimate the Kd value to be > than the highest protein concentration used for respective lipid vesicle. (E) Kd values determined for each recombinant protein using the methods pictured and described in D. Sequence logo is derived from HT signal of P. falciparum secretory proteins. Amino acids are represented by one-letter abbreviations and color-coded as follows: blue, basic; red, acidic; black, hydrophobic; and green, polar. Height of amino acids indicates their frequency at that position. Also see Table S2.
Figure 3
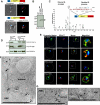
Figure 3. PI(3)P is detected in P. falciparum endoplasmic reticulum
(A) Live P. falciparum-infected erythrocytes expressing the FYVE domain of EEA1 as a mCherry fusion recruited to secretory pathway via an ER-type signal sequence. The wild type FYVE domain of EEA1 (EEA1WT), which binds PI(3)P with nanomolar affinity exhibits perinuclear staining (top panel). The point mutant FYVE domain of EEA1 (EEA1R1374A) that fails to bind PI(3)P shows peripheral staining expected for proteins undergoing default secretion to the PV (bottom panel). Left panels, brightfield images with Hoechst 33342 nuclear staining (blue); right panels, fluorescence images. Dotted lines in the top panel and arrows (both panels) indicate the location of the PV. Scale bars, 5 μm. Also see Figure S3A. (B) Western blot of non-transfected 3D7 and transgenic parasites expressing EEA1WT or EEA1R1374A fused to mCherry. A single band at 42-kDa was detected (arrow) for each fusion. Molecular weight standards in kDa are shown in the left. (C) The ER-type signal sequence (SS) of EEA1WT is cleaved confirming recruitment of EEA1WT to the secretory pathway. EEA1WT-mCherry, purified from parasites was digested with AspN and analyzed by LC-MS/MS. Mass spectra revealed that the most N-terminal peptide is Ac-AARSMEKLQTKVL.E, suggesting efficient cleavage of the signal sequence by signal peptidase. Ac- indicates acetylation on N-terminal alanine. Observed b and y ions are shown on the peptide sequence and the MS/MS spectra with neutral loss of water indicated by “o”, +1 ions shown in black and +2 ions shown in blue on the peptide sequence. When multiple forms (different charge states or water loss) of an ion were observed, only one form is indicated on the peptide sequence. The observed and calculated masses (M+H) are 1516.8542 and 1516.8515 respectively indicating a 1.8 ppm mass error. (D) Saponin lysis of transgenic parasites expressing secretory EEA1WT and EEA1R1374A. Western blots (top row) indicate that EEA1R1374A is detected into the supernatant (S) and thus released into the PV, while EEA1WT is retained within the parasite pellet (P). The parasite cytosolic protein PfFKBP (middle row) is not released, confirming parasite integrity. PfHRPII (bottom row) exported to the erythrocyte and EEA1R1374A released in the PV are also detected in parasite pellets (P) because they are continuously synthesized there. Molecular weight standards in kDa are shown in the left. Also see Figure S3B. (E) Localization of EEA1WT-mCherry as a marker for PI(3)P in the parasite ER. Transgenic parasites were fixed, permeabilized and probed with anti-mCherry as well as antibodies to endogenous P. falciparum markers (green) of the ER, like BIP (top row) and plasmepsin V (Pl. V, second row); a marker of the Golgi (ERD2, third row) or the PVM (Exp-2, bottom row). EEA1WT (red) is seen in punctuate `spots' within the ER. Dotted circles show location of red cell membrane. Dotted squares show regions magnified in the right panels. Parasite nuclei were stained with Hoechst 33342 (blue). Scale bars, 5 μm. Also see Figure S3C. (F–G) Immuno-electronmicroscopy showing localization of EEA1WT-mCherry in perinuclear membranes and its co-association with the ER marker BiP. F. Thin sections, probed with anti-mCherry and secondary antibody gold conjugates (10 nm) show label concentrated in membrane regions emerging from reticular membrane apposed to the nucleus (arrows), consistent with localization in the ER. G. Thin sections probed for EEA1WT-mCherry (10 nm gold) and BiP (15 nm gold). Arrowheads show closed localization of BiP and EEA1WT site. RBC, red blood cells; P, parasite. Scale bar, 0.5 μm. Control data for immunogold labeling is shown in Figure S3D.
Figure 4
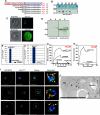
Figure 4. Endogenous HT signal on precursor PfHRPII (pPfHRPII) in the ER associates with PI(3)P both in vitro and in vivo
(A) Sequence of RFP fusions containing the first 40 amino acids present on pPfHRPII, and truncations, used in B. The pentameric HT core in each sequence is underlined. Peptide regions used to design anti-peptide pre-HT and post-HT antibodies are boxed in red and blue, respectively. (B) Coomassie-stained gel of paired uninduced and IPTG- induced of E. coli lysates expressing recombinant N-terminal fusions as indicated in A (top panel) were probed with pre-HT antibody (bottom panel). Fusions 5 and 6 that lack the pre-HT sequence are not recognized by pre-HT antibody. Molecular weight standards (kDa) are shown. (C) Pre-HT antibodies recognize a PfHRPII form within the parasite (top panel). Post-HT antibodies recognize PfHRPII forms in the parasite and erythrocyte (bottom panel). Nuclei were stained with Hoechst 33342 (blue). Brightfield images, left; fluorescent images, right. Scale bars, 5 μm. (D) The pre-HT antibody recognizes pPfHRPII as a single protein band slightly above 50-kDa (asterisk in the left panel), present in the pellet (P) fraction of tetanolysin-permeabilized infected erythrocytes but not in the supernatant (S) fraction. Post-HT antibody recognizes a single band at 50-kDa in the supernatant (S) fraction indicating exported and processed, mature HRPII (mPfHRPII). In the P fraction, post-HT antibody recognizes both mPfHRPII (indicated by arrowhead) and pPfHRPII (asterisk in the right panel). Molecular weight standards (kDa) are shown. (E) Quantitation of PI(3)P bound to pPfHRPII and mPfHRPII. pPfHRPII was immunoprecipitated and the amount of PI(3)P bound was detected by mass ELISA kit. Lysates pre-cleared of pPfHRPII were subjected to immunoprecipitation using post-HT antibodies and PI(3)P amount was determined. To determine non-specific binding, lysates (without pre-clearing pPfHRPII) were incubated with beads and processed identically. Samples were quantitated using PI(3)P standard curve as shown in Figure S4. Data represents mean +/− SEM from triplicates. (F) Quantitation of PI(3)P bound by the wild type FYVE domain of EEA1 (EEA1WT) and the point mutant (EEA1R1374A) in transgenic parasites. The assay was carried out essentially as described in F. Samples were quantitated using PI(3)P standard curve as shown in Figure S4. Data represents mean +/− SEM from triplicates. (G) SPR sensorgrams showing PI(3)P binding for pPfHRPII, mPfHRPII (as described in F); and pre-HT antibody alone. Sensograms were also generated for purified p40-phox-PX (226 nM). (H) SPR sensorgrams of pPfHRPII for PI(4)P. Immunopurified pPfHRPII (as described in E) was used to detect binding to PI(4)P by SPR. Purified FAPP1-PH (1 μM) was used as a control for PI(4)P binding. (I) Relative distribution of endogenous HT signal in pPfHRPII (green) and EEA1WT-mCherry (red) as detected by indirect immunofluorescence assays. Single optical sections of 20 nm thickness are shown. Dotted circles in the left panels indicate red cell membrane. Region within dotted squares are magnified in the right panels. Yellow (and marked by white arrows) indicates sites of EEA1WT-mCherry/PI(3)P colocalization with endogenous pPfHRPII (merge). Scale bars, 5 μm. (J) Immunoelectron micrograph showing sites of colocalization of EEA1WT-mCherry/PI(3)P (10 nm gold) with endogenous pPfHRPII (15 nm gold). Arrows shows close colocalization of pPfHRPII and EEA1WT in the perinuclear region. Scale bar, 5 μm.
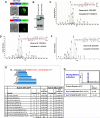
Figure 5
Figure 5. P. infestans Nuk10 HT signal shows PI(3)P binding- dependent export and is not cleaved by plasmepsin V
(A) Live P. falciparum-infected erythrocytes expressing a secretory chimera of the HT signal of P. infestans Nuk10-WT-GFP (top panel) and corresponding mutant Nuk10-Mut-GFP (lower panel). Left, brightfield images with Hoechst 33342 nuclear staining (blue); right, fluorescence images. Scale bars represent 5 μm. (B) Western blot of Nuk10-WT-GFP and Nuk10-Mut-GFP (indicated by arrows) immunopurified from parasites Lower bands at ~27-kDa indicates free GFP. Molecular weight standards (in kDa) are shown in the right. The mobility of Nuk10-WT-GFP and Nuk10-Mut-GFP are identical to that seen when these proteins are expressed in E. coli indicating that mobility differences are not due to processing by malaria parasites (data not shown). (C–D) Mass spectroscopy analysis of N-terminal peptides, derived from Nuk10-WT-GFP (C) and Nuk10-Mut-GFP (D) chimeras in panel A are shown and indicate that both are cleaved by signal peptidase. Ac- indicates acetylated N-terminus and M* indicates dynamic oxidation of Methionine. Observed b and y ions are shown on the peptide sequence and the MS/MS spectra and neutral loss of water is indicated by “o”. The +1 ions are shown in black, +2 ions shown in blue and neutral loss of water in green on the peptide sequence. When multiple forms (different charge states or water loss) of an ion were observed, only one form is indicated on the sequence. Observed and calculated M+H masses for B and C are: peptide B obs. 1785.8937, calc. 1785.8912 (1.4 ppm mass error) and peptide C obs. 1785.8944 and calc. 1785.8912 (1.8 ppm mass error). Also see Figure S5. (E) Comparison of top ten peptides obtained after AspN digestion and the area under the curve for each, shows that signal peptidase processing is equivalent in purified Nuk10-WT-GFP and mutant Nuk10-Mut-GFP. The presence of AAAA at the cleavage site generates heterogeneity at the N-terminus, but at levels that are comparable between the two chimeras. Peptides are represented in blue and the acetylated N-termini are represented in grey. M* denotes dynamic oxidation of Methionine and Ac- denotes N-terminal acetylation. ND, not detected. Also see Figure S5 and Table S3 for a complete list of peptides. (F) The HT signal RQLR in Nuk10-WT-GFP chimera is not cleaved by plasmepsin V. Nuk10-WT-GFP was purified from transgenic parasites, digested with AspN and analyzed by LC-MS/MS. Peptide yield of DRQLRGFYATEN*TDPVNNQ.D indicates that plasmepsin V cleavage is not essential for export of Nuk10-WT-GFP. N* denotes deamidation of Asparagine. Observed b and y ions are shown on the peptide and the MS/MS spectra with +1 ions shown in black, +2 ions shown in blue and neutral loss of water in green on the peptide sequence. When multiple forms (different charge states or water loss) of an ion were observed, only one form is indicated on the peptide sequence. Spectrum shown is charge state +3. The observed and calculated masses (M+H) are 2239.0398 and 2239.0374 respectively with a resulting mass error of 1.1 ppm. Also see Figure S5. (G) Sequence logo derived of HT signal from P. infestans secretory proteins and binding of P. infestans Nuk10 HT signal and corresponding mutant to PI(3)P. Amino acids are represented by one-letter abbreviations and color-coded as follows: blue, basic; red, acidic; black, hydrophobic; and green, polar. Height of amino acids indicates their frequency at that position. Kd values of Nuk10-WT and Nuk10-mutant were determined as described in Fig. 2D.
Figure 6
Figure 6. Evidence for HT-independent protein export to the red cell
(A) Four alanines were placed between the predicted signal sequence cleavage and the pentameric HT core (RLLYE) or its mutant (ALAYA). In live P. falciparum infected erythrocytes expressing SS-AAAA-HT-GFP, GFP is exported to the red cell (top panel) and the HT signal (RLLYE) is efficiently cleaved by plasmepsin V (pV; for mass spec analysis of peptides, also see Figure S6). Expression of SS-AAAA-ALAYA-GFP also results in GFP export and cleavage by signal peptidase (SP) at the AAAA site (also see Figure S6). Expression of SSAAAA-ALAYA-down-GFP with all charge residues downstream of ALAYA replaced with alanine, fails to result in export GFP (bottom panel), despite cleavage by SP at the AAAA site (also see Figure S6). SP shows heterogeneous cleavage at the AAAA site. Brightfield images with Hoechst 33342 nuclear staining (blue), left; fluorescent images, right. The scale bars represent 5 μm. (B) Live P. falciparum-infected erythrocytes expressing PfEMP3-RSLAQ-GFP exports GFP to the red cell (top panel), and the HT signal (RSLAQ) is efficiently cleaved by pV (also see Figure S6). PfEMP3xQ-GFP, with modified SP site and lacking HT signal, does not export GFP (center panel) although it undergoes cleavage by SP at the AQ. However, placement of four alanines (SP cleavage site) upstream of mutated motif in PfEMP3-A4-ASAAA-GFP, results in export of GFP and cleavage by SP occurs at AAAA site. SP shows heterogeneous cleavage at the AAAA site. Schematic representation of each construct and cleavage site is shown at the top. Brightfield images also show Hoechst 33342 nuclear staining (blue), the scale bars represent 5 μm. Also see Figure S6 for detailed LC-MS/MS analyses.
Figure 7
Figure 7. A model for PI(3)P dependent export from the ER of P. falciparum-infected erythrocytes
Proteins containing the malarial HT-signal (purple square) or the oomycete HT signal (grey square) are co-translationally inserted via their signal anchor sequence (blue square) into the ER membrane (step 1). The HT signals recognize the lipid PI(3)P (blue hexagons) enriched in regions of the ER (step 2) and may occur co-translationally (not shown). Secretory proteins with a plasmepsin V-refractory HT signal, are cleaved by signal peptidase (red pac-man) but remain associated to PI(3)P. Proteins with the malarial HT signal are cleaved by plasmepsin V (orange pac-man, step 3) which also destroys the PI(3)P binding signal and thus is likely to occur in a newly pinched off vesicle or one whose contents do not freely diffuse with the ER. Plasmepsin V and PI(3)P are recycled back to the ER (step 4), while cargo targeted to the erythrocyte moves forward across the parasite plasma membrane (PPM), and PVM (step 5). In default secretion, secretory proteins are co-translationally translocated into the ER (step 1′), the signal sequence (blue square) is cleaved by signal peptidase (red pac-man; steps 2′ and 3′) and protein is delivered through vesicular intermediates to PPM, and released into the PV (steps 4′ and 5′). PI(3)P/HT- independent export to the erythrocyte may reflect a third sorting step (in the ER, or later step of transport to PPM (red arrows) before further export (step 6′). Steps 1–5 have ~400 predicted cargo proteins exported to the erythrocyte and thus likely the dominant pathway of protein export to the erythrocyte. The role of the Golgi in these pathways is not known. A translocon has been proposed in export to the erythrocyte, but how it recognizes HT signals lost in the ER is unknown.

References

    1. Bhattacharjee S, Hiller NL, Liolios K, Win J, Kanneganti TD, Young C, Kamoun S, Haldar K. The malarial host-targeting signal is conserved in the Irish potato famine pathogen. PLoS Pathog. 2006;2:e50. - PMC - PubMed
    1. Boddey JA, Hodder AN, Gunther S, Gilson PR, Patsiouras H, Kapp EA, Pearce JA, de Koning-Ward TF, Simpson RJ, Crabb BS, et al. An aspartyl protease directs malaria effector proteins to the host cell. Nature. 2010;463:627–631. - PMC - PubMed
    1. Chang HH, Falick AM, Carlton PM, Sedat JW, DeRisi JL, Marletta MA. N-terminal processing of proteins exported by malaria parasites. Mol Biochem Parasitol. 2008;160:107–115. - PMC - PubMed
    1. Cooke BM, Buckingham DW, Glenister FK, Fernandez KM, Bannister LH, Marti M, Mohandas N, Coppel RL. A Maurer's cleft-associated protein is essential for expression of the major malaria virulence antigen on the surface of infected red blood cells. J Cell Biol. 2006;172:899–908. - PMC - PubMed
    1. Crary JL, Haldar K. Brefeldin A inhibits protein secretion and parasite maturation in the ring stage of Plasmodium falciparum. Mol Biochem Parasitol. 1992;53:185–192. - PubMed

Publication types

MeSH terms