. 2012 Jan 20;148(1-2):273-84.
doi: 10.1016/j.cell.2011.10.047.

Gene regulatory logic for reading the Sonic Hedgehog signaling gradient in the vertebrate neural tube

Affiliations

Gene regulatory logic for reading the Sonic Hedgehog signaling gradient in the vertebrate neural tube

Nikolaos Balaskas et al. Cell. .

Abstract

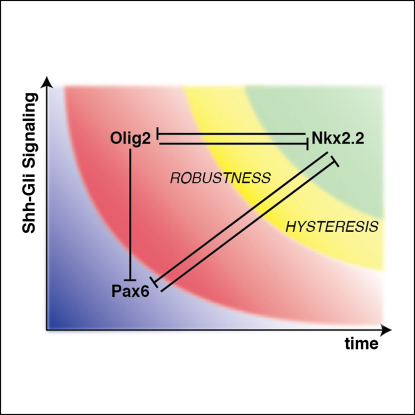
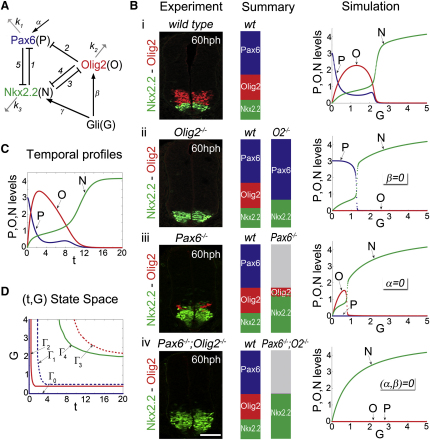
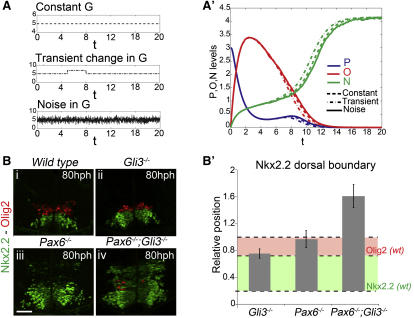
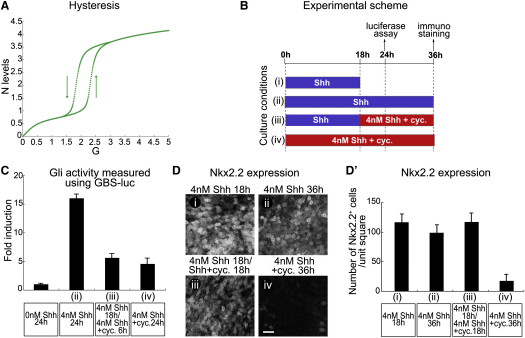
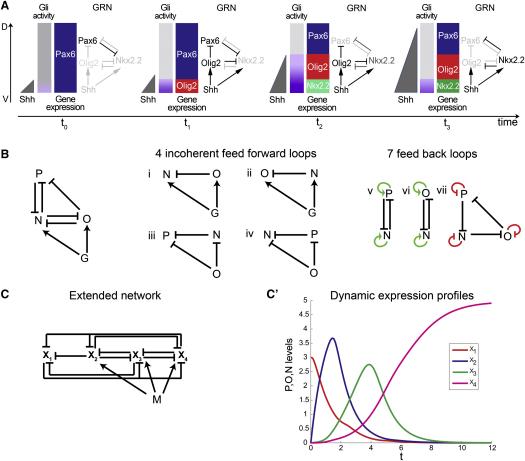
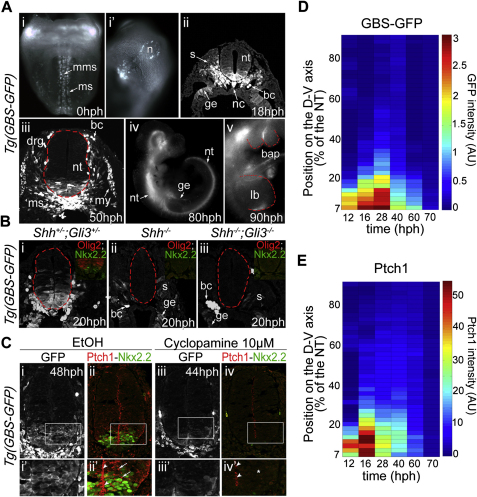
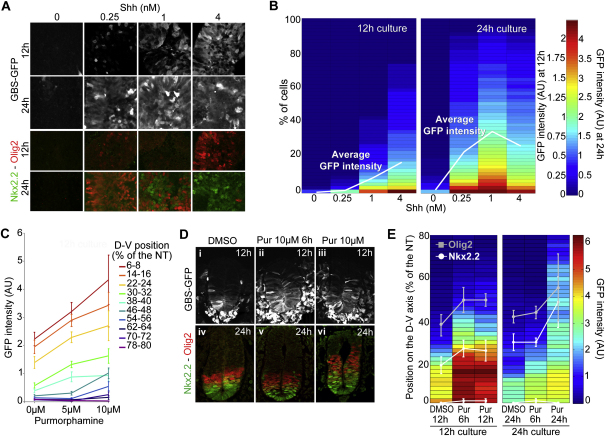
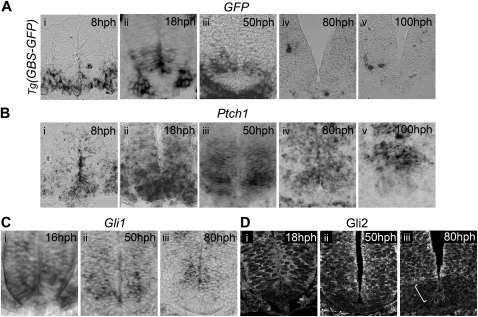
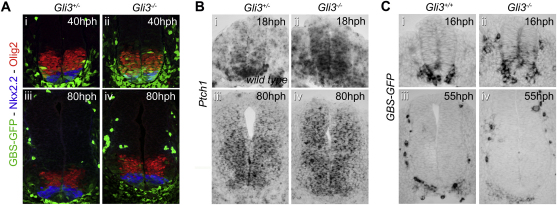
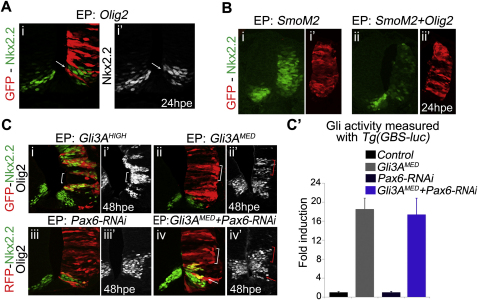
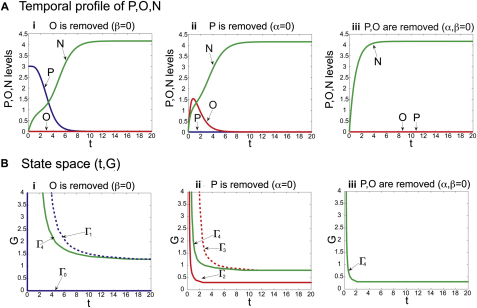
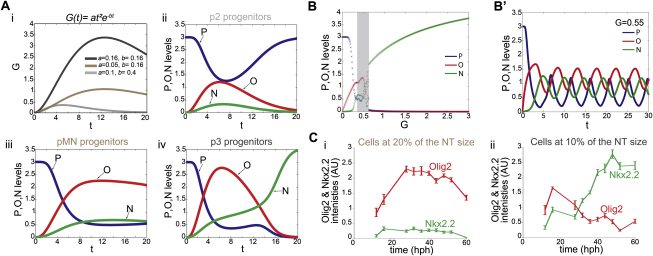
Secreted signals, known as morphogens, provide the positional information that organizes gene expression and cellular differentiation in many developing tissues. In the vertebrate neural tube, Sonic Hedgehog (Shh) acts as a morphogen to control the pattern of neuronal subtype specification. Using an in vivo reporter of Shh signaling, mouse genetics, and systems modeling, we show that a spatially and temporally changing gradient of Shh signaling is interpreted by the regulatory logic of a downstream transcriptional network. The design of the network, which links three transcription factors to Shh signaling, is responsible for differential spatial and temporal gene expression. In addition, the network renders cells insensitive to fluctuations in signaling and confers hysteresis--memory of the signal. Our findings reveal that morphogen interpretation is an emergent property of the architecture of a transcriptional network that provides robustness and reliability to tissue patterning.


Figures

None
Graphical abstract
Figure 1
Figure 1
Comparison of Spatial and Temporal Dynamics of Intracellular Shh Signaling and Ptch1 Protein (A) Shh, secreted from the notochord and floor plate (FP), forms a gradient in the neural tube that divides ventral neural progenitors into molecularly distinct domains. V3 interneurons are generated from Nkx2.2+ p3 progenitors; motor neurons (MN) from Olig2+ pMN progenitors; and V2 neurons are derived from p2 progenitors, expressing Pax6, but not Olig2. (B) Expression of GFP (green) and Ptch1 (red) at brachial level in Tg(GBS-GFP) embryos at the indicated stages. (C) Tg(GBS-GFP) activity (GFP fluorescent intensity in arbitrary unit [AU]; mean ± SD) as a function of dorsal-ventral (D-V) position (μm) in embryos of the indicated stages. (D) Average Tg(GBS-GFP) activity in the neural tube (mean + SEM in arbitrary unit [AU]) at relative distances (percentage [%] of the neural tube) from the floor plate in embryos of the indicated stages (n ≥ 3 embryos/stage). (E) Quantification of Ptch1 protein (mean fluorescent intensity ± SEM in arbitrary unit [AU]) at relative distances (percentage [%] of the neural tube) from the floor plate in embryos of the indicated stages (n ≥ 3 embryos/stage). For embryo stages see Table S1. See also Figures S1–S3.
Figure 2
Figure 2
Correlation of Gli Activity and Gene Expression Patterns in Wild-Type and Gli3 Mutant Embryos (A) GFP (green), Olig2 (red), Nkx2.2 (blue), and Pax6 (red) at brachial level in Tg(GBS-GFP) embryos at the indicated stages. (B) Heat map of GFP intensity in Tg(GBS-GFP) embryos at relative positions measured from the basal side of floor plate cells (percentage [%] of the neural tube) at the indicated stages. The position of the dorsal boundary of Olig2+ and the dorsal and ventral boundaries of Nkx2.2+ domains (mean ± SD) are indicated. (C) Tg(GBS-GFP) activity in brachial regions of the neural tube of 40 and 80 hph Gli3+/+ and Gli3−/− mouse embryos. The red dashed lines outline the pial surface of the neural tube. (D) Relationship between GFP intensity (AU) in embryos containing Tg(GBS-GFP) and dorsal limits of Olig2 and dorsal and ventral boundaries of Nkx2.2+ domain along the DV axis (percentage [%] of the neural tube) in Gli3+/+ and Gli3−/− embryos at the indicated stages. Scale bars, 50 μm. For embryo stages see Table S1. See also Figure S4.
Figure 3
Figure 3
Olig2 and Pax6 Control the Morphogen Response of Nkx2.2 to Shh Signaling (A) Nkx2.2 (green) and Olig2 (red) expression at forelimb levels of 50 and 80 hph wild-type, Olig2−/−, Pax6−/−, and Pax6−/−;Olig2−/− embryos. (B) Measurements of the dorsal boundary of Nkx2.2 expression in wild-type and Olig2−/− embryos at 50 hph (mean ± SD; p values from Student's t test). The average positions of Nkx2.2 (light green) and Olig2 (light red) expression domains in wild-type embryos are indicated. (C) Measurements of the dorsal boundary position of Nkx2.2 expression in Pax6−/− and Pax6−/−;Olig2−/− embryos (n ≥ 3 embryos; mean ± SD of the Nkx2.2 boundary) at the indicated stages. The normal positions of the Nkx2.2 and Olig2 domains in wild-type embryos are indicated in the shaded regions, and all positions are normalized to that of wild-type Olig2. The Nkx2.2 boundary in Pax6−/−;Olig2−/− mutant embryos is significantly different from wild-type litter-mates (p values from Student's t test, 50 hph: p < 0.0005; 60 hph: p < 5 × 10−9; 80 hph: p < 0.05). (D) Nkx2.2 (blue), Olig2 (red), and GFP (green) in forelimb regions of mouse embryos of the indicated genotype and stage (n ≥ 2 embryos for each data point). (E) Quantification of the levels of Tg(GBS-GFP) activity in Gli3, Pax6;Olig2 mutants, and control wild-type or heterozygous sibling embryos (Ctl Sib). Heat maps depict GFP (mean intensity in arbitrary units [AU]) and the dorsal boundaries of Nkx2.2 (white) and Olig2 (gray) (mean ± SD) along the D-V axis (distances from the floor plate in percentage [%] of the neural tube). Scale bars, 50 μm. For embryo staging see Table S1. See also Figure S5.
Figure 4
Figure 4
GRN for Shh Morphogen Interpretation (A) Summary of the genetic network and parameters used for modeling. The regulatory network connects Shh-Gli signaling (G), Pax6 (P), Olig2 (O), and Nkx2.2 (N). “1–5” represents the cross-repressive interactions between the TFs, parameterized by Hill coefficients, hi, (i = 1–5) and critical values NcritP, OcritP, NcritO, OcritN, and PcritN. The ki (i = 1–3) values are degradation rates. (B) Experiment represents expression of Nkx2.2 (green) and Olig2 (red) in 60 hph brachial neural tube of wild-type and mutant mice. Summary illustrates schematic of expression patterns in the indicated genetic backgrounds. Simulation shows output of the numerical simulations of the model in (A). Values of P, O, and N from numerical simulations plotted as a function of G (for t = 20). Output of the model with P, O, or both P and O removed was obtained with parameter regimes where (α = 0), (β = 0), or (α, β = 0), respectively. (C) Temporal profile of P, O, and N for G = 5 (t, time). (D) (t,G) state space of the model indicating the values of G and t for which P, O, or N dominates. Lines (Γ0–Γ4) indicate the values of G and t at which P (blue, Γ0, Γ1), O (red, Γ2, Γ3), N (green, Γ4) are equal to 1; solid lines indicate the threshold at which the value increases above 1, in the positive t or G direction; dotted lines indicate the threshold at which the value decreases below 1, in the positive t or G direction. The line Γ0 represents the expression of P when (t, G) = 0. Scale bars, 50 μm. For embryo stages see Table S1. See also Figure S6, and Tables S2 and S3.
Figure 5
Figure 5
The GRN Buffers Fluctuations in Shh Signaling (A) Schematic of Gli activity with a constant value, or with a transient increase (step function), or with a white noise term (in all cases, the base level is G = 5; white noise: mean = 5, amplitude = 1). (A′) Output of the model for a constant G (dashed line), a transient increase in G (dashed-gapped line), and G with a white noise (solid line) (in all cases, the base G = 5). (B) Nkx2.2 (green) and Olig2 (red) expression at forelimb levels of 80 hph mouse neural tubes from the indicated genotypes. (B′) Position of the dorsal boundary of the Nkx2.2+ domain in Gli3−/−, Pax6−/−, and Pax6−/−;Gli3−/− embryos at 80 hph. For comparison the colored shading indicates the Nkx2.2 (light green) and Olig2 (light red) expression in wild-type embryos. All positions are normalized to that of the dorsal limit of wild-type Olig2. Scale bars, 50 μm. For embryo stages see Table S1.
Figure 6
Figure 6
The GRN Confers Hysteresis (A) A plot of N as a function of G illustrating bistability (t = 20). (B) Schematic of the experiments in (C) and (D). (i) Explants were incubated with 4 nM Shh for 18 hr, (ii) 4 nM Shh for 36 hr, (iii) 4 nM Shh for 18 hr followed by 4 nM Shh plus 50 nM cyclopamine (Cyc) for 18 hr, or (iv) 4 nM Shh plus 50 nM Cyc for 36 hr. (C) Gli activity (relative Gli activity ± SEM) measured with GBS-luc in (i) explants treated in the indicated conditions for 24 hr. Gli activity is plotted relative to the activity in explants cultured in the absence of Shh. (D) Nkx2.2 expression in (i) explants cultured in the indicated conditions (Scale bars, 20 μm). (D′) Number of cells expressing Nkx2.2 in (i) explants in the indicated conditions (n ≥ 3 explants; two units/explant; number of cells per unit ± SD).
Figure 7
Figure 7
A Model for Morphogen Interpretation (A) Schematic of Shh signaling-mediated patterning of the ventral neural tube. At t0, low levels of Shh protein, emanating from the notochord, are translated into low levels of intracellular Gli activity, which are not sufficient to induce Olig2 and Nkx2.2 or to repress Pax6. As development progresses, increasing production of Shh ligand generates a gradient of Gli activity that increases in amplitude (t1), then reaches a peak (t2) before retracting (t3). Gli activity is interpreted by ventral progenitors by the GRN: Olig2 is initially induced (t1) and represses Pax6. Subsequently, Nkx2.2 is induced (t2) and represses Pax6 and Olig2. Hysteresis maintains these domains of expression as the amplitude of the Gli activity decreases (t3). (B) The regulatory circuit connecting G, N, O, and P is composed of four interconnected incoherent feed forward loops (IFFL). These are type 1 and type 2 IFFLs (Alon, 2007). Two type 1 IFFL link G, N, and O (i and ii), whereas two type 2 IFFL connect P, N, and O (iii and iv). The arrangement results in each factor receiving positive (v and vi, green arrows) and negative feedback (vii, red blunt arrows). (C) A generalization of the 3-transcription factor gene regulatory circuit and an extension of the network to include an additional component. M is the morphogen signal and Xi the transcription factors. The additional transcription factor is added to the network by two interconnected type 1 IFFL. (C′) Graph depicting the long-time steady-state profiles of X1 (red), X2 (blue), X3 (green), and X4 (pink) from the system in (B) and (C). See also Figure S7.
Figure S1
Figure S1
The Activity of the Tg(GBS-GFP) Reports Shh Signal Transduction, Related to Figure 1 (A) Tg(GBS-GFP) activity in Shh signaling responding tissues. The GFP expression was assessed in Tg(GBS-GFP) embryos at the indicated stages. i, i′, and iv, v are respectively ventral and lateral views of whole mount embryos. ii and iii are transverse sections at brachial levels. GFP was first observed in peripheral node cells (n), medial mesoderm (mms) as well as adjacent ventral mesoderm (ms). Later, GFP expression appeared throughout the ventral part of the neural tube (nt), the posterior limb bud (lb), the gut endoderm (ge), within the ventral somites (s) and then within the derived myotome (my), as well as within the first branchial pouch (bap). GFP was also present in blood cells (bc) and dorsal root ganglia (drg). (B) The majority of Tg(GBS-GFP) activity is absent in embryos lacking Shh and positive Gli activity. Expression of GFP in Tg(GBS-GFP) in transverse sections of Shh+/-;Gli3+/- (i), Shh-/- (ii) and Shh-/-;Gli3-/- (iii) 20hph embryos at brachial levels. (C) Inhibition of Smo activity by Cyclopamine decreases Tg(GBS-GFP) activity. Expression of GFP (white), Ptch1 (red) and Nkx2.2 (green) in Tg(GBS-GFP) mouse embryos cultured from the 12hph stage for 24h in control media (i–ii′) or with the Smo inhibitor Cyclopamine (iii–iv′). i′, ii′, iii′, iv′ are expanded images of the regions indicated with white boxes in i, ii, iii, iv, respectively. Arrowheads indicate puncta of Ptch1 protein at the apical surface of neuroprogenitor cells, while arrows point out Ptch1 protein in vesicle-like structures at more basal levels. The star in iv′ indicates the reduced levels of Ptch1 protein at basal levels upon Cyclopamine treatment. (D) Quantification of Tg(GBS-GFP) activity in the neural tube. The heat map indicates GFP intensity (mean in arbitrary units (AU)) along the dorsal-ventral axis (distance from the apical side of the floor plate cells in % of the neural tube). (E) Quantification of Ptch1 protein expression along the dorsal-ventral axis of the neural tube. The heat maps indicate Ptch1 intensity (mean in arbitrary units (AU)) at the indicated dorsal-ventral positions. For embryo stages see Table S1.
Figure S2
Figure S2
Tg(GBSGFP) Responds to Changes in Shh Signaling, Related to Figure 1 (A and B) Levels of Tg(GBS-GFP) activity track levels of Shh signaling. (A) Naïve [i] explants extracted from the intermediate neural plate of 8-12hph Tg(GBS-GFP) mouse embryos and cultured in presence of the indicated Shh concentrations for 12 or 24h, analyzed for the expression of GFP (white), Olig2 (red) and Nkx2.2 (green). Similarly to ex vivo experiments performed with chick tissue (Dessaud et al., 2007; 2010), increasing concentration and duration of Shh exposure led to a progressive switch from Olig2 to Nkx2.2 induction in mouse explants. (B) Quantification of Tg(GBS-GFP) activity in explants treated with the indicated Shh concentrations for 12h and 24h. The intensity of GFP in each cell of the assayed region was measured (arbitrary unit (AU); n≥3 explants/condition) and plotted as a % of cells within explants. The white line reports the mean GFP intensity calculated from these measurements. Exposure to different concentrations of Shh for 12h resulted in corresponding differences in both the number of cells containing detectable Tg(GBS-GFP) activity and the levels of GFP within individual cells. At 24h, consistent with the induction of feedback mechanisms in cells responding to Shh that changes the sensitivity of cells to Shh over time, the level of GFP in explants was no longer perfectly correlated with Shh concentration. (C) The activity of Tg(GBS-GFP) responds to increases in the levels of Smo activity in vivo. Quantification of Tg(GBS-GFP) activity in embryos cultured ex vivo with 0, 5 and 10μM of Purmorphamine, a Smo agonist, for 12h from stage 8-12hph. Average GFP intensity (mean ± s.e.m. in arbitrary unit (AU)) at relative distances (% of the neural tube) from the floor plate. (D and E) The establishment of the Nkx2.2 dorsal boundary is robust to transient increases in Shh signaling. (D) GFP (white), Nkx2.2 (green) and Olig2 (red) expression in Tg(GBS-GFP) embryos after 12h or 24h of culture ex vivo from stage 8-12hph. Embryos were exposed to 0μM or 10μM Purmorphamine for 6h (Pur 10μM 6h) or for the entire period of culture (Pur 10μM). (E) Quantification of Tg(GBS-GFP) activity in embryos after 12h or 24h of culture ex vivo and exposed to 0μM or 10μM Purmorphamine for 6h (Pur 6h) or for the entire period of culture (Pur 12h or Pur 24h). Heat maps illustrate GFP intensity (mean in arbitrary units (AU)) along the dorso-ventral axis (distance from the floor plate in μm) and the positions of the dorsal boundary of Nkx2.2 (white line) and Olig2 (gray line) expression (mean ± s.d.) in embryos from the indicated conditions (n≥3 embryos/condition). In embryos cultured for 6h in presence of 10μM of Purmorphamine, the levels of Gli activity detected after 12h of culture were as much increased as in embryos exposed with the agonist for 12h. In contrast at 24h, while the position of Nkx2.2 and Olig2 dorsal boundaries in embryos exposed to the drug for 6h was similar to that of DMSO treated embryos, these boundaries were shifted dorsally in embryos treated for 24h with Purmorphamine. For embryo stages see Table S1.
Figure S3
Figure S3
Correlation between the Dynamics of Tg(GBS-GFP) Activity and Ptch1, Gli1, and Gli2 Expression, Related to Figure 1 Temporal-spatial profiles of GFP (A), Ptch1 (B) and Gli1 (C) mRNA and Gli2 protein (D) at brachial levels of Tg(GBS-GFP) (A) and wild type embryos (B–D) at the indicated stages. (A) GFP transcripts were detected by 8hph in the ventral neural tube (i). From this stage, the expression of Tg(GBS-GFP) expanded progressively dorsally (ii and iii). Concomitantly, Tg(GBS-GFP) expression was extinguished within the most ventral cells of the neural tube which represent the presumptive floor plate (ii and iii). After 50hph GFP mRNA could not be detected within neural progenitor cells (iv and v; data not shown). (B) Ptch1 mRNA was present in the ventral neural tube by 8hph (i). Between 10-18hph, Ptch1 expanded dorsally and was distributed in a graded manner; strong in ventral midline cells and weaker dorsally (ii). Then, its expression was progressively extinguished from the floor plate, but it remained expressed at moderate levels within the p3 domain and at low levels within the dorsal half of the neural tube (iii and iv). By 100hph, Ptch1 transcripts were detected in most neural progenitor cells, with the exception of the floor plate. The levels of its expression were relatively weak within the p3 domain and stronger within the pMN domain (v). (C) Gli1 mRNA initially displays a ventral to dorsal gradient that extends to half the size of the neural tube (i), its expression is then progressively downregulated from the floor plate cells (ii) and later from the p3 cells (iii). (D) Gli2 protein is detected within the entire neural tube (data not shown) but gets progressively downregulated from the floor plate cells (I and ii) and the p3 domain (white brackets) (iii). For embryo stages see Table S1.
Figure S4
Figure S4
Comparison of Gli Activity with Expression of Nkx2.2 and Olig2 in Mutants for Gli3, Related to Figure 2 (A) Expression of Nkx2.2 (blue), Olig2 (red) and GFP (green) in forelimb regions of mouse embryos of the indicated genotype and stage. The amplitude and range of GFP was markedly increased in 40hph Gli3-/- embryos compared to Gli3+/- littermates of the same stage, whereas the expression of Nkx2.2 and Olig2 was similar in mutant and control embryos (i and ii). Expression of Nkx2.2, Olig2 and GFP was comparable in Gli3+/- and Gli3-/- mouse embryos at 80hph (iii and iv). (B) Ptch1 expression in forelimb regions of wild type, Gli3+/- and Gli3-/- embryos at the indicated stages. Compared to wild type, a dorsal expansion and increase in the intensity of Ptch1 expression was observed in 18hph and 80hph Gli3-/- embryos. (C) In situ hybridization for GFP in Tg(GBS-GFP) embryos lacking or wild-type for Gli3 at the indicated stages. Similarly to the profile of GFP protein expression, the GFP transcripts were dorsally expanded in Gli3-/- mutants compared to wild type embryos (i and ii). This ectopic expression of GFP lasted for a short period of time, as GFP was not detected in wild type nor Gli3 mutant embryos by 55hph (iii and iv). A summary of embryo staging is given in Table S1.
Figure S5
Figure S5
Nkx2.2 Is Repressed by Olig2 and Induced by Medium Levels of Gli Activity in Absence of Pax6, Related to Figure 3 (A and B) Olig2 represses Nkx2.2. HH12 stage chick in ovo electroporation of Olig2 (A) or SmoM2 with (Bii and Bii′) or without Olig2 (Bi and Bi′) expression constructs. Embryos were assayed for Nkx2.2 expression (green in Ai, B, white in Ai′) 24h post electroporation (hpe). Olig2 was sufficient to repress Nkx2.2 in a cell-autonomous manner (arrows in A). Expression of Olig2 blocks the ability of SmoM2, a constitutively active form of Smoothened, to up-regulate Nkx2.2 (B). (C and C′) Nkx2.2 responds to medium levels of Gli activity after Pax6 knock-down. (C) Electroporation of the indicated constructs at HH12 stage chick embryos and analysis of Nkx2.2 (green) and Olig2 (white) expression at 48hpe. All sections are from the forelimb and anterior thoracic regions of embryos. Nkx2.2 and Olig2 were ectopically induced in dorsal and intermediate regions of neural tube, electroporated with Gli3AHIGH (i and i′). Olig2 (ii′), but not Nkx2.2 (ii) were induced in Gli3AMED-transfected cells. Two Pax6-RNAi constructs were used to knock-down Pax6 expression. When introduced alone into the neural tube these had no effect on Nkx2.2 (iii) or Olig2 (iii′) expression. Transfection of Gli3AMED and Pax6-RNAi together resulted in the dorsal expansion of Nkx2.2 (iv) and Olig2 (iv′; red brackets). This indicates that reducing Pax6 expression potentiates the ability of moderate levels of Gli activity to induce Nkx2.2. Moreover, these embryos exhibit repression of Olig2 expression probably as a result of Nkx2.2 dorsal expansion (arrows in iv and iv′). (C′) HH10-12 stage chick embryos were electroporated with the indicated constructs together with the GBS-Luc reporter and normalization plasmid. Graphs show the relative luciferase activity 24h after transfection (mean ± s.e.m.). Reduction in the level of Pax6 by RNAi did not alter the level of Gli activity induced by Gli3AMED.
Figure S6
Figure S6
The Temporal Behavior of the Gene Regulatory Network, Related to Figure 4 (A) Temporal profiles of P (blue), O (red) and N (green) when: (i) O is removed (β=0); (ii) P is removed (α=0); (iii) both P and O are removed (α, β=0) (See also Figure 4C). Each dataset was generated by solving the model equations numerically with Matlab (ode45 solver) for the model parameters given in Table S2 and G=5. (B) (t,G) State space representations of the model output indicating the values of G and t for which PHIGH, OHIGH, or NHIGH dominate. The lines (Γ1-Γ4) indicate the values of G and t at which P (blue, Γ0, Γ1), O (red, Γ2, Γ3), N (green, Γ4) are equal to 1; solid lines indicate the threshold at which the value increases above 1, in the positive t or G direction; dotted lines indicate the threshold at which the value decreases below 1, in the positive t or G direction. The line Γ0 represents the expression of P when t, G=0. Removing O from the model (β=0) shifts the threshold of N domination to lower values of G and shorter periods of time (i). Removal of P (α=0) from the model decreases more markedly the value of G and time at which N is induced (ii). The threshold for N domination shifts further to lower values of G and time when both P and O are removed from the model (α, β=0) (iii).
Figure S7
Figure S7
The GRN Has the Potential to Generate Oscillations and to Interpret a Temporally Changing Level of Signaling, Related to Figure 7 (A) To simulate, in the model, the temporally changing Gli activity profile observed in vivo (Figures 1D and 1E), the function G(t)=at2ebt, was used. Three profiles of G(t) (represented with black, brown and gray lines) were generated using different values of a and b (i). Numerically derived profiles of P (blue), O (red) and N (green) as a function of time for the three simulated values of G(t). For the high G(t) profile (black line) P decreases and O is induced at early times, then N increases and O decreases. This behavior mimics the profile of gene expression observed in the p3 domain (iv). For the medium G(t) profile (brown line), O increases and P decreases to a low but sustained level. This mimics the gene expression profile in pMN progenitors (iii). For the low G(t) profile (gray line), the value of G never reaches a level sufficient to activate O and P is expressed throughout the simulation – this mimics the establishment of the p2 domain (ii). (B and B′) Changing the parameters of the model (Table S2) reveals the potential for oscillations. For a range of G values (shading gray area) (B) the system produced oscillations in time (t) (B′). The periodic output was evident within the switch from OHIGH to NHIGH for intermediate values of G (G=0.75). Parameter values α=3, β=5, γ=5, h1=6, h2=10, h3=5, h4=1, h5=2, k1=k2=k3=1, NcritP=OcritP=1, PcritN=0.5, OcritN=5, NcritO=1. (C) Quantification of Nkx2.2 and Olig2 expression levels over time in cells located at 10% (ii) and 20% (ii) of the NT size. Within cells committed to a pMN fate at 20% of the NT size, the levels of Olig2 expression progressively increase to reach a plateau around ∼25hph. In these cells Nkx2.2 levels remain barely detectable. In contrast in cells fated to be p3 cells, Olig2 expression levels peak at 18hph then progressively decrease. The decrease in Olig2 expression correlated with the induction of Nkx2.2, the expression of which plateaus at ∼50hph. These dynamics predicted by the model in Aiii and Aiv are strikingly reminiscent of that of Ci and Cii, respectively.

References

    1. Ahn S., Joyner A.L. Dynamic changes in the response of cells to positive hedgehog signaling during mouse limb patterning. Cell. 2004;118:505–516. - PubMed
    1. Alon U. Network motifs: theory and experimental approaches. Nat. Rev. Genet. 2007;8:450–461. - PubMed
    1. Bergmann S., Sandler O., Sberro H., Shnider S., Schejter E., Shilo B.Z., Barkai N. Pre-steady-state decoding of the Bicoid morphogen gradient. PLoS Biol. 2007;5:e46. - PMC - PubMed
    1. Bollenbach T., Pantazis P., Kicheva A., Bökel C., González-Gaitán M., Jülicher F. Precision of the Dpp gradient. Development. 2008;135:1137–1146. - PubMed
    1. Briscoe J., Sussel L., Serup P., Hartigan-O'Connor D., Jessell T.M., Rubenstein J.L., Ericson J. Homeobox gene Nkx2.2 and specification of neuronal identity by graded Sonic hedgehog signalling. Nature. 1999;398:622–627. - PubMed

Supplemental References

    1. Buscher, D., Grotewold, L., and Ruther, U. (1998). The XtJ allele generates a Gli3 fusion transcript. Mamm. Genome 9, 676–678. - PubMed
    1. Chung, J.H., Whiteley, M., and Felsenfeld, G. (1993). A 5′ element of the chicken beta-globin domain serves as an insulator in human erythroid cells and protects against position effect in Drosophila. Cell 74, 505–514. - PubMed
    1. Das, R.M., Van Hateren, N.J., Howell, G.R., Farrell, E.R., Bangs, F.K., Porteous, V.C., Manning, E.M., McGrew, M.J., Ohyama, K., Sacco, M.A., et al. (2006). A robust system for RNA interference in the chicken using a modified microRNA operon. Dev. Biol. 294, 554–563. - PubMed
    1. Dessaud, E., Ribes, V., Balaskas, N., Yang, L.L., Pierani, A., Kicheva, A., Novitch, B.G., Briscoe, J., and Sasai, N. (2010). Dynamic assignment and maintenance of positional identity in the ventral neural tube by the morphogen sonic hedgehog. PLoS Biol. 8, e1000382. - PMC - PubMed
    1. Dessaud, E., Yang, L.L., Hill, K., Cox, B., Ulloa, F., Ribeiro, A., Mynett, A., Novitch, B.G., and Briscoe, J. (2007). Interpretation of the sonic hedgehog morphogen gradient by a temporal adaptation mechanism. Nature 450, 717–720. - PubMed

Publication types

MeSH terms