. 2012 Jan 20;148(1-2):362-75.
doi: 10.1016/j.cell.2011.11.060.

Computational modeling of pancreatic cancer reveals kinetics of metastasis suggesting optimum treatment strategies

Affiliations

Computational modeling of pancreatic cancer reveals kinetics of metastasis suggesting optimum treatment strategies

Hiroshi Haeno et al. Cell. .

Abstract

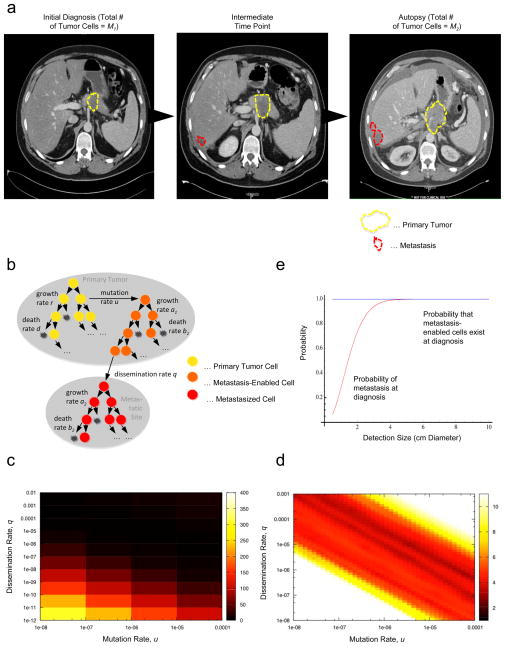
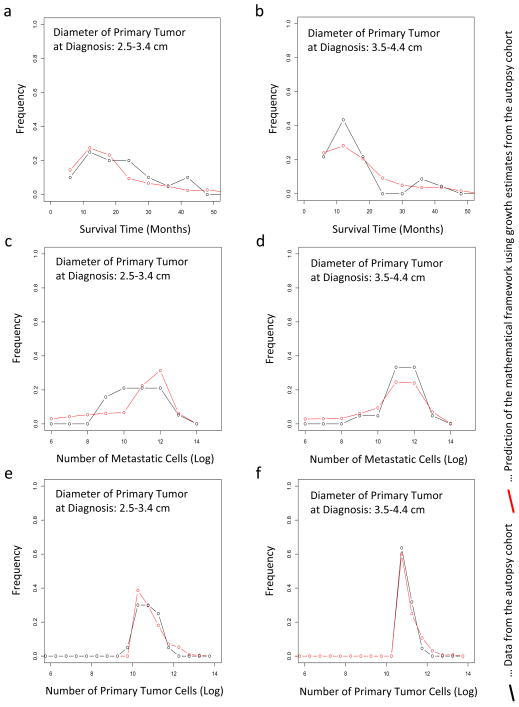
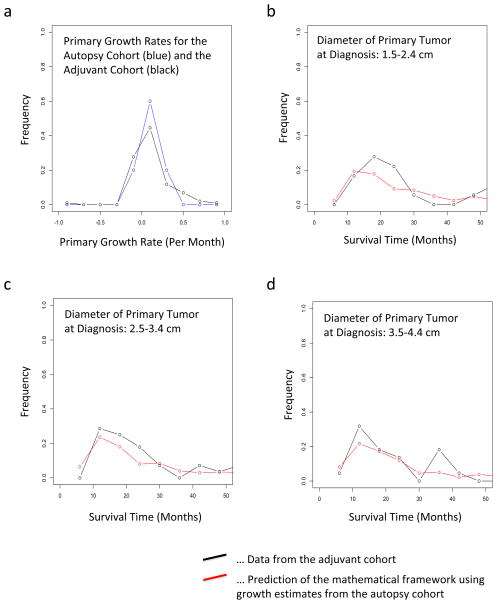
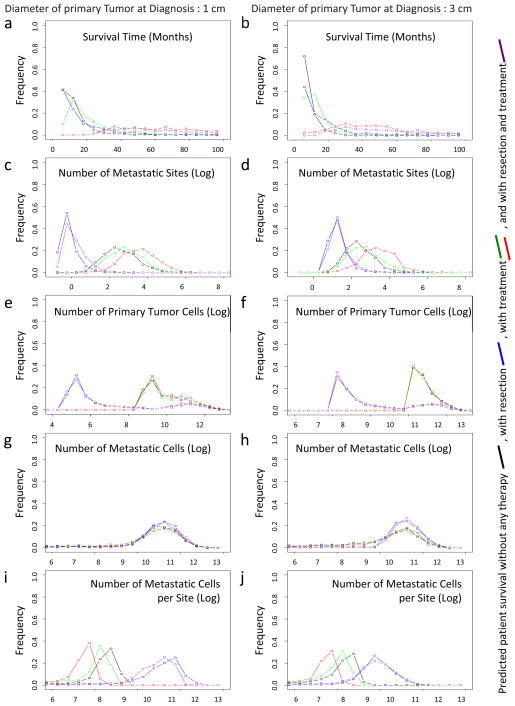
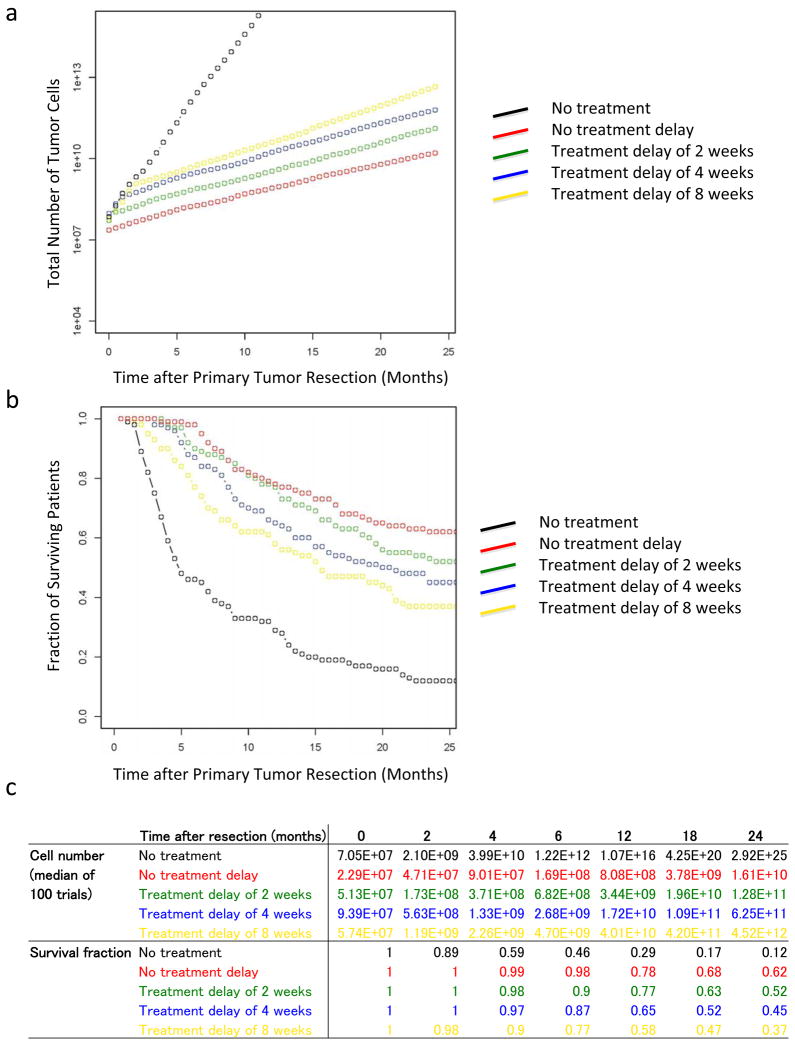
Pancreatic cancer is a leading cause of cancer-related death, largely due to metastatic dissemination. We investigated pancreatic cancer progression by utilizing a mathematical framework of metastasis formation together with comprehensive data of 228 patients, 101 of whom had autopsies. We found that pancreatic cancer growth is initially exponential. After estimating the rates of pancreatic cancer growth and dissemination, we determined that patients likely harbor metastases at diagnosis and predicted the number and size distribution of metastases as well as patient survival. These findings were validated in an independent database. Finally, we analyzed the effects of different treatment modalities, finding that therapies that efficiently reduce the growth rate of cells earlier in the course of treatment appear to be superior to upfront tumor resection. These predictions can be validated in the clinic. Our interdisciplinary approach provides insights into the dynamics of pancreatic cancer metastasis and identifies optimum therapeutic interventions.


Figures

Figure 1
Figure 1. A mathematical framework of pancreatic cancer progression allows the prediction of growth and dissemination kinetics
(a) Computed tomography (axial view) of one representative patient at initial diagnosis, one intermediate time point five months later, and then again at 7 months after diagnosis, which was also one week before death. In each image the primary pancreatic cancer is indicated in dashed yellow outlines and the liver metastases by dashed red outlines. (b) The mathematical framework. The model considers three cell types: type-0 cells, which have not yet evolved the ability to metastasize, reside in the primary tumor where they proliferate and die at rates r and d. They give rise to type-1 cells at rate u per cell division; these cells have evolved the ability to metastasize but still reside in the primary tumor, where they proliferate and die at rates a1 and b1, respectively, and disseminate to a new metastatic site at rate q per time unit. Once disseminated, cells are called type-2 cells and proliferate and die at rates a2 and b2, respectively. This mathematical framework can be used to determine quantities such as the risk of metastatic disease at diagnosis and the expected number of metastasized cells at death. (c and d) Estimated mutation and dissemination rates allow the prediction of the probability of metastasis at diagnosis. The color represents the deviations between the data and the results of the mathematical model; we used patient data on the number of metastatic sites and metastatic cells for the estimation, and then calculated the geometric mean of the two values for each point. Darker colors represent the region of fit between theory and data. Panel d provides a more detailed analysis of the data shown in panel c. (e) The panel shows the probability of metastasis at diagnosis (red curve) and the probability of the existence of cells in the primary tumor that have evolved the potential to metastasize (blue curve). Parameters are u = 6.31·10−5, q = 6.31·10−7, r = a1 = 0.16, a2 = 0.58, d = b1 = 0.01r, and b2 = 0.01a2.
Figure 2
Figure 2. The predictions of the mathematical framework are validated using patient data
(a and b) The panels show the distribution of survival times of patients who were diagnosed with primary tumors with a diameter of 2.5 – 3.4 cm (panel a) and of 3.5 – 4.4 cm (panel b). (c–d) The panels show the distribution of the number of metastatic cells at autopsy of patients who were diagnosed with primary tumors with a diameter of 2.5 – 3.4 cm (panel c) and of 3.5 – 4.4 cm (panel d). (e–f) The panels show the distribution of the number of primary tumor cells at autopsy of patients who were diagnosed with primary tumors with a diameter of 2.5 – 3.4 cm (panel e) and of 3.5 – 4.4 cm (panel f). In all panels, the red curves represent the prediction of the mathematical framework and the black lines represent the data. We observed no significant difference between the predictions and the data; the p-values are (a) 0.26, (b) 0.63, (c) 0.54, (d) 0.47, (e) 0.13, and (f) 0.11. Parameters are u = 6.31·10−5, q = 6.31·10−7, d = b1 = 0.01r, b2 = 0.01a2 and γ = 0.7. Tumor size at autopsy was obtained from the normal distribution with mean 11.2 and variance 0.46 in a base 10 logarithmic scale for each calculation. The growth rate of primary tumor cells and metastatic tumor cells are obtained from the normal distribution with mean 0.16 and variance 0.14, and mean 0.58 and variance 2.72, respectively.
Figure 3
Figure 3. Validation of our framework using an independent patient cohort
(a) The distribution of the primary growth rate from the original dataset including 101 patients is shown in red and that from the additional data in black; for the latter, only 10 patients had sufficient follow-up measurements (size at diagnosis, intermediate, and death) such that the growth rate could be determined. (b) The panel shows the distribution of survival times of patients after resection of the primary tumor with 2 (1.5–2.4) cm diameter after diagnosis. The red curve represents the prediction of the mathematical framework and the black line represents the data. (c) The panel shows the distribution of survival times of patients after resection of the primary tumor with 3 (2.5–3.4) cm diameter after diagnosis. The red curve represents the prediction of the mathematical framework and the black line represents the data. (d) The panel shows the distribution of survival times of patients after resection of the primary tumor with 4 (3.5–4.4) cm diameter after diagnosis. The red curve represents the prediction of the mathematical framework and the black line represents the data. We observed no significant difference between the predictions and the data; the p-values are (a) 0.45, (b) 0.44, (c) 0.40, and (d) 0.41. Parameters used are u = 6.31·10−5, q = 6.31·10−7, d = b1 = 0.01r, b2 = 0.01a2 and γ = 0.7. Tumor size was obtained from a normal distribution with mean 11.2 and variance 0.46 in a base 10 logarithmic scale for each calculation. The growth rate of primary tumor cells and metastatic tumor cells were obtained from a normal distribution with mean 0.16 and variance 0.14, and mean 0.58 and variance 2.72, respectively.
Figure 4
Figure 4. The mathematical framework predicts optimum treatment strategies for pancreatic cancer patients
The panels show the predictions of different quantities for a tumor size of 1 cm diameter at diagnosis (left column) and 3 cm at diagnosis (right column). The tumor size at autopsy in a 10 base logarithmic scale was obtained from a normal distribution with mean 11.2 and variance 0.46 for each calculation. The growth rates of primary tumor cells and metastatic tumor cells were obtained from a normal distribution with mean 0.16 and variance 0.14; and mean 0.58 and variance 2.72, respectively. The black curve represents mathematical predictions of the survival time without treatment or resection, the blue curve with resection (removal of 99.99% of the primary tumor by surgery), the red and green curves with treatment (90% (red) and 50% (green) reduction of the growth rate), and purple curve with resection and treatment (removal of 99.99% of the primary tumor by surgery and 90% reduction of the growth rate). Parameters are u = 6.31·10−5, q = 6.31·10−7, d = b1 = 0.01r, b2 = 0.01a2, ε = 0.9999, and γ = 0.9 (red and purple curve) and γ = 0.5 (green curve). (a and b) Survival time. (c and d) The number of metastatic sites at autopsy. (e and f) The number of primary tumor cells. (g and h) The number of metastatic tumor cells. (i and j) The number of metastatic tumor cells per site. See also Figure S2–S7.
Figure 5
Figure 5. A delay in the initiation of therapy significantly increases tumor volume and shortens survival
The panels show the prognosis after surgery with different theoretical treatment options and treatment delays. Panel a shows the median of the number of tumor cells in 100 trials over time. Panel b shows the fraction of surviving patients in 100 trials at each time point. Panel c shows the numbers of tumor cells and the fraction of surviving patients. The tumor size at autopsy was obtained from a normal distribution with mean 11.2 and variance 0.46 in a 10 base logarithmic scale. The growth rates of primary tumor cells and metastatic tumor cells were obtained from a normal distribution with mean 0.16 and variance 0.14; and mean 0.58 and variance 2.72, respectively. The black curve represents the case with no treatment after surgery, the red curve with starting treatment immediately after surgery, and the green, blue, and yellow curves with starting treatment 2, 4, and 8 weeks after surgery, respectively. Parameters are u = 6.31·10−5, q = 6.31·10−7, d = b1 = 0.01r, b2 = 0.01a2, ε = 0.9999, and γ = 0.7.

Comment in

References

    1. Amikura K, Kobari M, Matsuno S. The time of occurrence of liver metastasis in carcinoma of the pancreas. Int J Pancreatol. 1995;17:139–146. - PubMed
    1. Andasari V, Gerisch A, Lolas G, South AP, Chaplain MA. Mathematical modeling of cancer cell invasion of tissue: biological insight from mathematical analysis and computational simulation. J Math Biol. 2011;63:141–171. - PubMed
    1. Artinyan A, Anaya DA, McKenzie S, Ellenhorn JD, Kim J. Neoadjuvant therapy is associated with improved survival in resectable pancreatic adenocarcinoma. Cancer. 2011;117:2044–2049. - PubMed
    1. Arvold ND, Niemierko A, Mamon HJ, Fernandez-Del Castillo C, Hong TS. Pancreatic Cancer Tumor Size on CT Scan Versus Pathologic Specimen: Implications for Radiation Treatment Planning. Int J Radiat Oncol Biol Phys. 2011;80:1383–1390. - PMC - PubMed
    1. Ayoub JP, Hess KR, Abbruzzese MC, Lenzi R, Raber MN, Abbruzzese JL. Unknown primary tumors metastatic to liver. J Clin Oncol. 1998;16:2105–2112. - PubMed

Publication types