

Gene-centric metagenomics analysis of feline intestinal microbiome using 454 junior pyrosequencing
- PMID: 22265636
- PMCID: PMC7114314
- DOI: 10.1016/j.mimet.2012.01.001
Gene-centric metagenomics analysis of feline intestinal microbiome using 454 junior pyrosequencing
Abstract
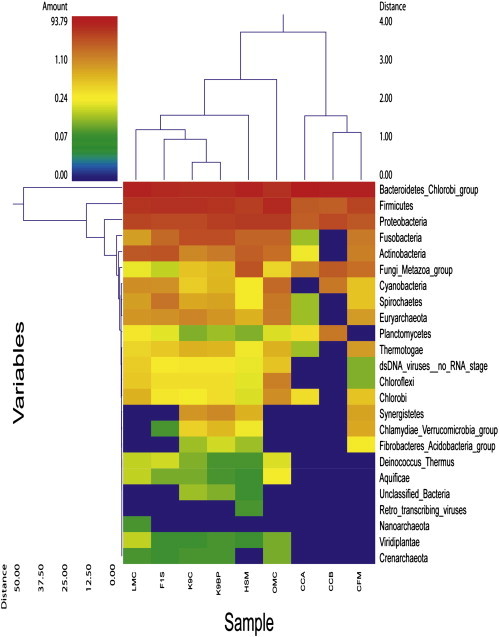
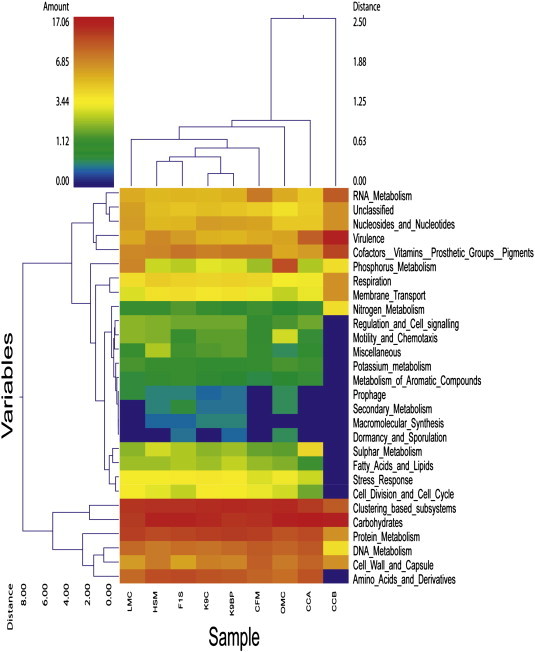
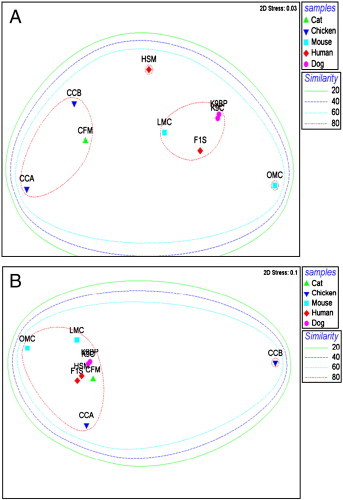
The feline gastrointestinal microbiota have direct influence on feline health and also human health as a reservoir for potential zoonotic pathogens and antibiotic resistant bacterial strains. In order to describe the feline gastrointestinal microbial diversity, fecal samples from cats have been characterized using both culture-dependent and culture-independent methods. However, data correlating total microbial composition and their functions are lacking. Present descriptive study evaluated both phylogenetic and metabolic diversity of the feline intestinal microbiota using GS Junior titanium shotgun pyrosequencing. A total of 152,494 pyrosequencing reads (5405 assembled contigs) were generated and classified into both phylogenetic and metabolic profiles of the feline intestinal microbiota. The Bacteroides/Chlorobi group was the most predominant bacterial phylum comprising ~68% of total classified diversity, followed by Firmicutes (~13%) and Proteobacteria (~6%) respectively. Archaea, fungi and viruses made up the minor communities in the overall microbial diversity. Interestingly, this study also identified a range of potential enteric zoonotic pathogens (0.02-1.25%) and genes involved in antimicrobial resistance (0.02-0.7%) in feline fecal materials. Based on clustering among nine gastrointestinal metagenomes from five different monogastric hosts (dog, human, mice, cat and chicken), the cat metagenome clustered closely together with chicken in both phylogenetic and metabolic level (>80%). Future studies are required to provide deeper understandings on both intrinsic and extrinsic effects such as impact of age, genetics and dietary interventions on the composition of the feline gastrointestinal microbiome.
Copyright © 2012 Elsevier B.V. All rights reserved.
Figures
References
-
- Angulo F.J., Swerdlow D.L. Bacterial enteric infections in persons infected with human immunodeficiency virus. Clin. Infect. Dis. 1995;21(Suppl. 1):S84–S93. - PubMed
-
- Angulo F.J., Glaser C.A., Juranek D.D., Lappin M.R., Regnery R.L. Caring for pets of immunocompromised persons. J. Am. Vet. Med. Assoc. 1994;205:1711–1718. - PubMed
-
- Carmack B.J. The role of companion animals for persons with AIDS/HIV. Holist. Nurs. Pract. 1991;5:24–31. - PubMed
-
- Conway de Macario E., Macario A.J. Methanogenic archaea in health and disease: a novel paradigm of microbial pathogenesis. Int. J. Med. Microbiol. 2009;299:99–108. - PubMed
MeSH terms
LinkOut - more resources
Full Text Sources
Miscellaneous
