BACE1 elevation is associated with aberrant limbic axonal sprouting in epileptic CD1 mice
- PMID: 22265658
- PMCID: PMC3514910
- DOI: 10.1016/j.expneurol.2012.01.003
BACE1 elevation is associated with aberrant limbic axonal sprouting in epileptic CD1 mice
Abstract
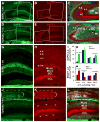
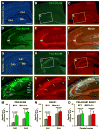
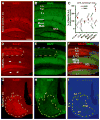
The brain is capable of remarkable synaptic reorganization following stress and injury, often using the same molecular machinery that governs neurodevelopment. This form of plasticity is crucial for restoring and maintaining network function. However, neurodegeneration and subsequent reorganization can also play a role in disease pathogenesis, as is seen in temporal lobe epilepsy and Alzheimer's disease. β-Secretase-1 (BACE1) is a protease known for cleaving β-amyloid precursor protein into β-amyloid (Aβ), a major constituent in amyloid plaques. Emerging evidence suggests that BACE1 is also involved with synaptic plasticity and nerve regeneration. Here we examined whether BACE1 immunoreactivity (IR) was altered in pilocarpine-induced epileptic CD1 mice in a manner consistent with the synaptic reorganization seen during epileptogenesis. BACE1-IR increased in the CA3 mossy fiber field and dentate inner molecular layer in pilocarpine-induced epileptic mice, relative to controls (saline-treated mice and mice 24-48 h after pilocarpine-status), and paralleled aberrant expression of neuropeptide Y. Regionally increased BACE1-IR also occurred in neuropil in hippocampal area CA1 and in subregions of the amygdala and temporal cortex in epileptic mice, colocalizing with increased IR for growth associated protein 43 (GAP43) and polysialylated-neural cell adhesion molecule (PSA-NCAM), but reduced IR for microtubule-associated protein 2 (MAP2). These findings suggest that BACE1 is involved in aberrant limbic axonal sprouting in a model of temporal lobe epilepsy, warranting further investigation into the role of BACE1 in physiological vs. pathological neuronal plasticity.
Published by Elsevier Inc.
Figures


Similar articles
-
Chronic temporal lobe epilepsy is associated with enhanced Alzheimer-like neuropathology in 3×Tg-AD mice.PLoS One. 2012;7(11):e48782. doi: 10.1371/journal.pone.0048782. Epub 2012 Nov 14. PLoS One. 2012. PMID: 23155407 Free PMC article.
-
Beta-secretase-1 elevation in transgenic mouse models of Alzheimer's disease is associated with synaptic/axonal pathology and amyloidogenesis: implications for neuritic plaque development.Eur J Neurosci. 2009 Dec;30(12):2271-83. doi: 10.1111/j.1460-9568.2009.07017.x. Epub 2009 Dec 10. Eur J Neurosci. 2009. PMID: 20092570 Free PMC article.
-
Regulation of Synaptic Amyloid-β Generation through BACE1 Retrograde Transport in a Mouse Model of Alzheimer's Disease.J Neurosci. 2017 Mar 8;37(10):2639-2655. doi: 10.1523/JNEUROSCI.2851-16.2017. Epub 2017 Feb 3. J Neurosci. 2017. PMID: 28159908 Free PMC article.
-
The normal and pathologic roles of the Alzheimer's β-secretase, BACE1.Curr Alzheimer Res. 2014;11(5):441-9. doi: 10.2174/1567205011666140604122059. Curr Alzheimer Res. 2014. PMID: 24893886 Free PMC article. Review.
-
BACE1 in Alzheimer's disease.Clin Chim Acta. 2012 Dec 24;414:171-8. doi: 10.1016/j.cca.2012.08.013. Epub 2012 Aug 20. Clin Chim Acta. 2012. PMID: 22926063 Review.
Cited by
-
Increased expression of the proapoptotic presenilin associated protein is involved in neuronal tangle formation in human brain.Sci Rep. 2024 Oct 25;14(1):25274. doi: 10.1038/s41598-024-77026-0. Sci Rep. 2024. PMID: 39455681 Free PMC article.
-
Amyloid plaque pathogenesis in 5XFAD mouse spinal cord: retrograde transneuronal modulation after peripheral nerve injury.Neurotox Res. 2013 Jul;24(1):1-14. doi: 10.1007/s12640-012-9355-2. Epub 2012 Oct 5. Neurotox Res. 2013. PMID: 23055086 Free PMC article.
-
Morinda citrifolia L. (noni) and memantine attenuate periventricular tissue injury of the fourth ventricle in hydrocephalic rabbits.Neural Regen Res. 2013 Mar 25;8(9):773-82. doi: 10.3969/j.issn.1673-5374.2013.09.001. Neural Regen Res. 2013. PMID: 25206724 Free PMC article.
-
27-Hydroxycholesterol Alters Synaptic Structural and Functional Plasticity in Hippocampal Neuronal Cultures.J Neuropathol Exp Neurol. 2019 Mar 1;78(3):238-247. doi: 10.1093/jnen/nlz002. J Neuropathol Exp Neurol. 2019. PMID: 30753597 Free PMC article.
-
Mossy fiber expression of αSMA in human hippocampus and its relevance to brain evolution and neuronal development.Sci Rep. 2025 May 6;15(1):15834. doi: 10.1038/s41598-025-00094-3. Sci Rep. 2025. PMID: 40328887 Free PMC article.
References
-
- Akram A, Christoffel D, Rocher AB, Bouras C, Kovari E, Perl DP, Morrison JH, Herrmann FR, Haroutunian V, Giannakopoulos P, Hof PR. Stereologic estimates of total spinophilin-immunoreactive spine number in area 9 and the CA1 field: relationship with the progression of Alzheimer’s disease. Neurobiol Aging. 2008;29:1296–1307. - PMC - PubMed
-
- Amatniek JC, Hauser WA, DelCastillo-Castaneda C, Jacobs DM, Marder K, Bell K, Albert M, Brandt J, Stern Y. Incidence and predictors of seizures in patients with Alzheimer’s disease. Epilepsia. 2006;47:867–872. - PubMed
-
- Arendt T. Alzheimer’s disease as a disorder of mechanisms underlying structural brain self-organization. Neuroscience. 2001;102:723–765. - PubMed
Publication types
MeSH terms
Substances
Grants and funding
LinkOut - more resources
Full Text Sources
Research Materials
Miscellaneous

