Single-particle tracking of immunoglobulin E receptors (FcεRI) in micron-sized clusters and receptor patches
- PMID: 22265688
- PMCID: PMC3413461
- DOI: 10.1016/j.febslet.2012.01.013
Single-particle tracking of immunoglobulin E receptors (FcεRI) in micron-sized clusters and receptor patches
Abstract
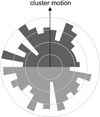
When mast cells contact a monovalent antigen-bearing fluid lipid bilayer, IgE-loaded FcεRI receptors aggregate at contact points and trigger degranulation and the release of immune activators. We used two-color total internal reflection fluorescence microscopy and single-particle tracking to show that most fluorescently labeled receptor complexes diffuse freely within these micron-size clusters, with a diffusion coefficient comparable to free receptors in resting cells. At later times, when the small clusters coalesce to form larger patches, receptors diffuse even more rapidly. In all cases, Monte Carlo diffusion simulations ensured that the tracking results were free of bias, and distinguished biological from statistical variation. These results show the diversity in receptor mobility in mast cells, demonstrating at least three distinct states of receptor diffusivity.
Copyright © 2012 Federation of European Biochemical Societies. Published by Elsevier B.V. All rights reserved.
Figures


Similar articles
-
Stimulated release of fluorescently labeled IgE fragments that efficiently accumulate in secretory granules after endocytosis in RBL-2H3 mast cells.J Cell Sci. 1998 Aug;111 ( Pt 16):2385-96. doi: 10.1242/jcs.111.16.2385. J Cell Sci. 1998. PMID: 9683633
-
Formation of a mast cell synapse: Fc epsilon RI membrane dynamics upon binding mobile or immobilized ligands on surfaces.J Immunol. 2010 Feb 1;184(3):1328-38. doi: 10.4049/jimmunol.0903071. Epub 2009 Dec 30. J Immunol. 2010. PMID: 20042583 Free PMC article.
-
Mechanism of the antigen-independent cytokinergic SPE-7 IgE activation of human mast cells in vitro.Sci Rep. 2015 Apr 20;5:9538. doi: 10.1038/srep09538. Sci Rep. 2015. PMID: 25892150 Free PMC article.
-
Requirements for effective IgE cross-linking on mast cells and basophils.Mol Nutr Food Res. 2006 Jul;50(7):620-4. doi: 10.1002/mnfr.200500272. Mol Nutr Food Res. 2006. PMID: 16764017 Review.
-
Negative signals from FcepsilonRI engagement attenuate mast cell functions.Arch Immunol Ther Exp (Warsz). 2007 Jul-Aug;55(4):219-29. doi: 10.1007/s00005-007-0028-4. Epub 2007 Jul 23. Arch Immunol Ther Exp (Warsz). 2007. PMID: 17659377 Review.
Cited by
-
RBL-2H3 Mast Cell Receptor Dynamics in the Immunological Synapse.Biophysica. 2022 Dec;2(4):428-439. doi: 10.3390/biophysica2040038. Epub 2022 Nov 7. Biophysica. 2022. PMID: 37654558 Free PMC article.
-
Near-field fluorescence cross-correlation spectroscopy on planar membranes.ACS Nano. 2014 Jul 22;8(7):7392-404. doi: 10.1021/nn502593k. Epub 2014 Jul 11. ACS Nano. 2014. PMID: 25004429 Free PMC article.
-
Dances with Membranes: Breakthroughs from Super-resolution Imaging.Curr Top Membr. 2015;75:59-123. doi: 10.1016/bs.ctm.2015.03.008. Epub 2015 Apr 15. Curr Top Membr. 2015. PMID: 26015281 Free PMC article. Review.
-
Insights from Fc receptor biology: a route to improved antibody reagents.MAbs. 2012 May-Jun;4(3):291-3. doi: 10.4161/mabs.20100. Epub 2012 Apr 26. MAbs. 2012. PMID: 22531437 Free PMC article.
-
CPB-3 and CGH-1 localize to motile particles within dendrites in C. elegans PVD sensory neurons.BMC Res Notes. 2021 Aug 14;14(1):311. doi: 10.1186/s13104-021-05730-5. BMC Res Notes. 2021. PMID: 34391474 Free PMC article.
References
-
- Metzger H. Transmembrane signaling: The joy of aggregation. J. Immunol. 1992;149:1477–1487. - PubMed
-
- Posner RG, Subramanian K, Goldstein B, Thomas J, Feder T, Holowka D, Baird BA. Simultaneous cross-linking by two nontriggering bivalent ligands causes synergistic signaling of IgE FcεRI complexes. J. Immunol. 1995;155:3601–3609. - PubMed
Publication types
MeSH terms
Substances
Grants and funding
LinkOut - more resources
Full Text Sources

