

doi: 10.1038/nmeth.1857.
An artery-specific fluorescent dye for studying neurovascular coupling
Affiliations
- PMID: 22266543
- PMCID: PMC3392962
- DOI: 10.1038/nmeth.1857
Item in Clipboard
An artery-specific fluorescent dye for studying neurovascular coupling
Nat Methods.
.
Abstract
We demonstrate that Alexa Fluor 633 hydrazide (Alexa Fluor 633) selectively labels neocortical arteries and arterioles by binding to elastin fibers. We measured sensory stimulus-evoked arteriole dilation dynamics in mouse, rat and cat visual cortex using Alexa Fluor 633 together with neuronal activity using calcium indicators or blood flow using fluorescein dextran. Arteriole dilation decreased fluorescence recorded from immediately underlying neurons, representing a potential artifact during neuronal functional imaging experiments.
Conflict of interest statement
The authors declare competing financial interests: details accompany the full-text HTML version of the paper at
Figures
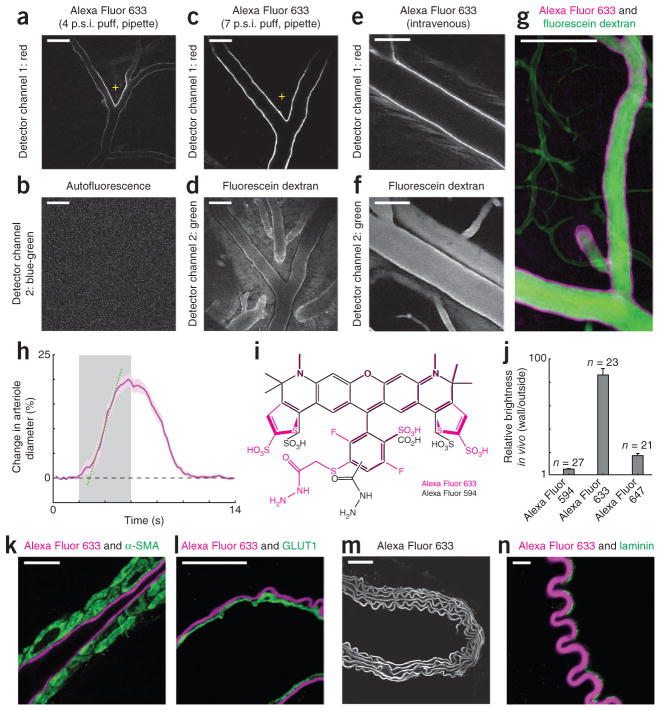
Selective labeling of artery walls by Alexa Fluor 633. (a,b) Two-photon microscopy image of the mouse visual cortex after a 4 pounds per square inch (p.s.i.) 1-s puff of Alexa Fluor 633 from a micropipette (a; + indicates tip position) and an autofluorescence image (b) obtained simultaneously in vivo using 2 mW laser power. (c,d) Image from the rat visual cortex after a 7 p.s.i. 1-s puff of Alexa Fluor 633 in vivo (c) and fluorescence image of the same cortical site taken after intravenous injection of fluorescein dextran (d). (e,f) Images of arteriole walls in mouse visual cortex after intravenous injection of Alexa Fluor 633 (e) and of the same site after injection of fluorescein dextran (f). (g) Average intensity 66 μm z-dimension projection image from mouse visual cortex after an intravenous injection of fluorescein dextran and local pipette injection of Alexa Fluor 633. (h) Dilation of an Alexa Fluor 633–labeled arteriole from the rat visual cortex in response to drifting grating visual stimuli (gray bar). The intersection between the regression line (dotted green) and zero level (dashed black) represents the latency of dilation (0.8 s). Purple shading indicates s.e.m. (n = 16 trials). (i) Molecular structures of Alexa Fluors 633 and 594. (j) Relative brightness of arteriole walls labeled with Alexa Fluors 594, 633 and 647. Data were pooled from five experiments in the rat cortex (error bars, s.e.m.). (k) Image of an immunostained section from the macaque monkey neocortex using an antibody to α-SMA and showing Alexa Fluor 633 labeling. (l) Image of an immunostained section of mouse neocortex with an antibody to GLUT1 and showing Alexa Fluor 633 labeling. (m) Image of a mouse aorta labeled with Alexa Fluor 633 and collected by using 2 mW two-photon laser power. (n) Image of a mouse femoral artery stained with an antibody to laminin and showing Alexa Fluor 633 labeling. In vivo images (a–f) were not background-subtracted or movement-corrected. Images shown in k, l and n were collected with sequential scanning confocal microscopy. Scale bars, 100 μm (a–g), 10 μm (k,l,n) and 50 μm (m).
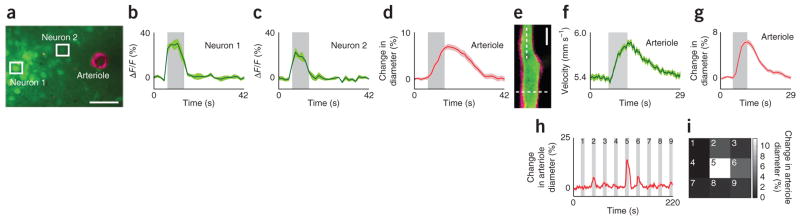
Monitoring sensory stimulus–evoked responses in arterioles and adjacent neurons. (a–d) Simultaneous tracking of neuronal activation using the calcium dye Oregon Green 488 Bapta-1 acetoxymethyl ester (OGB-1 AM) and changes in arteriole diameter using Alexa Fluor 633 in layer 2/3 of the cat visual cortex. Image of an Alexa Fluor 633–labeled (magenta) penetrating arteriole and adjacent neuronal cell bodies labeled with OGB-1 AM (green) (a). Scale bar, 50 μm. Time courses (averages of 24 trials) of responses to drifting grating visual stimuli from neurons (b,c) and arteriole (d) marked in a. ΔF/F, relative change in fluorescence. (e–g) Measurement of red blood cell velocity and vessel diameter in an arteriole of the rat visual cortex. Imaged field of view (e) showing an arteriole labeled with Alexa Fluor 633 (magenta) and its lumen labeled with fluorescein dextran (green). Scale bar, 20 μm. Time courses (averages of 32 trials) of increases in velocity (f) and diameter (g) in response to drifting grating visual stimuli measured at locations marked by dotted lines in e. (h,i) Dilation of an Alexa Fluor 633–labeled arteriole in the cat visual cortex (h) in response to the presentation of visual stimuli in each of the nine locations (3 × 3 grid) of a stimulus display monitor (i). Average responses to five repeats of the entire visual stimulus sequence are plotted in h. The response to each stimulus position is plotted in the corresponding location in the 3 × 3 grid in which the luminance value represents the dilation magnitude. All gray bars, period of visual stimulation; error bands, s.e.m.
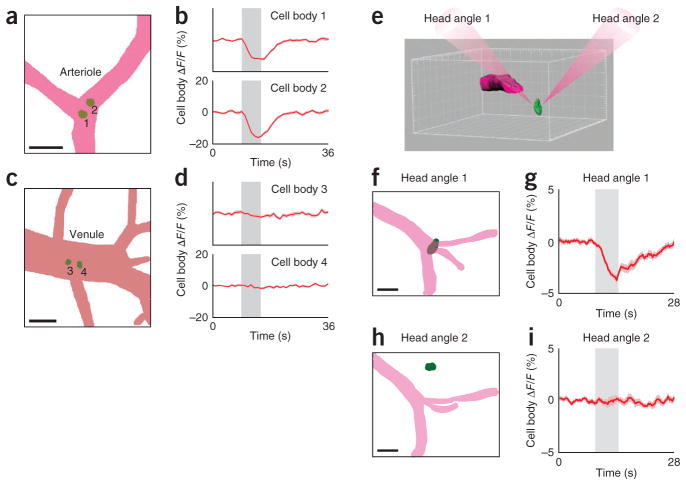
Stimulus-dependent modulation of fluorescence in neurons located under cortical surface arterioles but not venules. (a–d) Mask representations of the dorsal view of a surface arteriole (a), venule (c) and underlying neuronal soma (labeled 1–4) in the rat visual cortex, and Alexa Fluor 594 fluorescence in the indicated neurons after a visual stimulus, in the same rat (b,d; averages of 23 trials). (e) Rendering of a surface arteriole (magenta) and a neuronal soma (green) in an imaged cortical volume, illustrating the potential dependence of the neuronal imaging artifact on the relative positioning of an arteriole and a nearby neuron. The two paths of light were achieved by rotating the head of a mouse that was positioned under the two-photon microscope’s objective lens. In head angle 1, light passes through the surface arteriole. In head angle 2, light beam bypasses the arteriole. (f) Mask representation of an imaged area in mouse visual cortex (dorsal view) showing a surface arteriole (magenta) and a neuronal soma located directly below. (g) Alexa Fluor 594 fluorescence from the soma shown in f in response to visual stimuli. (h) Dorsal view of the same area as in f but after head rotation; soma is no longer under the arteriole. (i) Alexa Fluor 594 fluorescence in the soma shown in h in response to visual stimuli. Time courses in g and i are averages of 31 trials. All gray bars represent the period of visual stimulation; error bands, s.e.m.; scale bars, 50 μm.
References
Publication types
MeSH terms
Substances
Grants and funding
LinkOut - more resources
Full Text Sources
Molecular Biology Databases
Miscellaneous
