. 2012 May;56(5):1070-1079.
doi: 10.1016/j.jhep.2011.12.019. Epub 2012 Jan 17.

RETRACTED: Molecular forms of HMGB1 and keratin-18 as mechanistic biomarkers for mode of cell death and prognosis during clinical acetaminophen hepatotoxicity

Affiliations

RETRACTED: Molecular forms of HMGB1 and keratin-18 as mechanistic biomarkers for mode of cell death and prognosis during clinical acetaminophen hepatotoxicity

Daniel J Antoine et al. J Hepatol. 2012 May.

Retraction in

Expression of concern in

  • Expression of Concern.
    [No authors listed] [No authors listed] J Hepatol. 2018 Dec;69(6):1402. doi: 10.1016/j.jhep.2018.09.020. Epub 2018 Oct 16. J Hepatol. 2018. PMID: 30340775 No abstract available.

Abstract

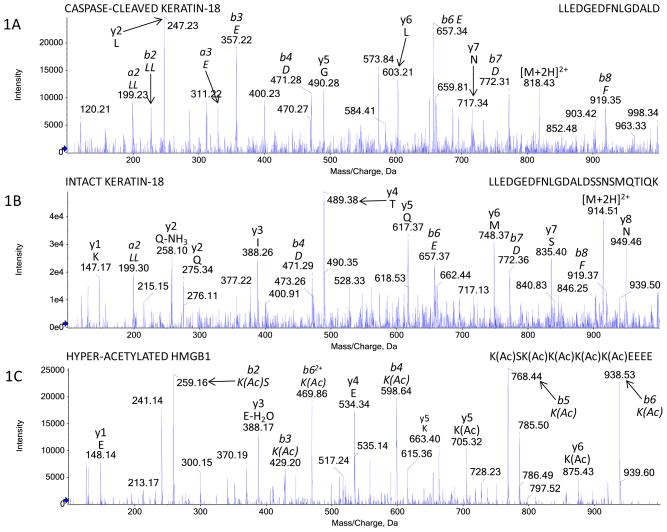
Background & aims: Full length keratin-18 (FL-K18) and High Mobility Group Box-1 (HMGB1) represent circulating indicators of necrosis during acetaminophen (APAP) hepatotoxicity in vivo. In addition, the caspase-cleaved fragment of K18 (cK18) and hyper-acetylated HMGB1 represent serum indicators of apoptosis and immune cell activation, respectively. The study aim was to assess their mechanistic utility to establish the balance between apoptosis, necrosis, and immune cell activation throughout the time course of clinical APAP hepatotoxicity.

Methods: HMGB1 (total, acetylated) and K18 (apoptotic, necrotic) were identified and quantified by novel LC-MS/MS assays in APAP overdose patients (n=78).

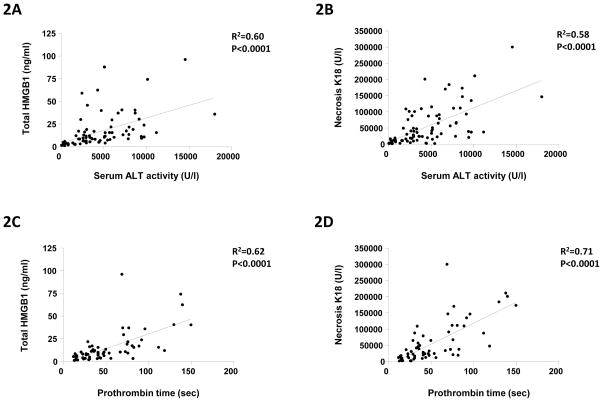
Results: HMGB1 (total; 15.4±1.9ng/ml, p<0.01, acetylated; 5.4±2.6ng/ml, p<0.001), cK18 (5649.8±721.0U/L, p<0.01), and FL-K18 (54770.2±6717.0U/L, p<0.005) were elevated in the sera of APAP overdose patients with liver injury compared to overdose patients without liver injury and healthy volunteers. HMGB1 and FL-K18 correlated with alanine aminotransferase (ALT) activity (R(2)=0.60 and 0.58, respectively, p<0.0001) and prothrombin time (R(2)=0.62 and 0.71, respectively, p<0.0001). Increased total and acetylated HMGB1 and FL-K18 were associated with worse prognosis (King's College Criteria) or patients that died/required liver transplant compared to spontaneous survivors (all p<0.05-0.001), a finding not reflected by ALT and supported by ROC analysis. Acetylated HMGB1 was a better predictor of outcome than the other markers of cell death.

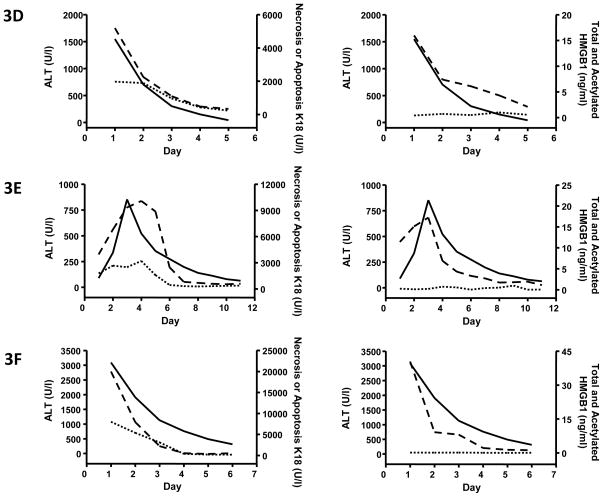
Conclusions: K18 and HMGB1 represent blood-based tools to investigate the cell death balance clinical APAP hepatotoxicity. Activation of the immune response was seen later in the time course as shown by the distinct profile of acetylated HMGB1 and was associated with worse outcome.


Conflict of interest statement

Disclosure

The authors wish to report no conflict of interest.

Figures

Fig. 1
Fig. 1. Mass spectrometric identification of circulating K18 and HMGB1 molecular forms following APAP overdose
Diagnostic LC-MS/MS spectra of tryptically derived peptides confirming the (A) cut cleavage-caspase site and the (B) uncleaved site present within K18 derived from apoptosis and necrosis respectively found in patient sera during APAP hepatotoxicity. (C) Diagnostic LC-MS/MS spectra of Glu-C derived peptides confirming the identification of hyper-acetylated HMGB1 derived from inflammatory cells present in patient sera during APAP hepatotoxicity. Figures are representative spectra of all APAP patients with ALI. Amino acids, b and y ions and peptide sequences are indicated on each spectrum. Acetylated Lysine residues within HMGB1 are represent by K(Ac).
Fig. 2
Fig. 2. HMGB1 and K18 quantification and correlation with currently used clinical standards for liver integrity (ALT activity, prothrombin time and encephalopathy)
Correlation between circulating total HMGB1 (ng/ml) and necrosis K18 (U/l) with either (AB) ALT activity (U/l) or (C–D) prothrombin time (sec) from individual APAP overdose patients with acute liver injury. Comparison of admission ALT activity (E), total HMGB1 content (F) and necrosis K18 (G) with maximum encephalopathy score. Combined data set from the UK and USA cohorts for biomarker determinations calculated from a blood sample obtained on day 1 or admittance into the study/presentation at the respective unit. Data is given for all patients admitted to the study. Regression analysis (R2) and statistical significance is indicated on each figure were required.
Fig. 3
Fig. 3. Representative quantitative time course profile of serum K18 and HMGB1 molecular forms in patients that died/required a liver transplant or survived following APAP-induced liver injury
Time course quantification of circulating total HMGB1 content (ng/ml – long dash), hyper-acetylated HMGB1 (ng/ml – short dash), apoptosis cK18 (U/l – short dash) and necrosis FL-K18 (U/l – long dash) from six representative patients from the study in comparison with ALT activity (U/l – solid black). All patients either died or required a liver transplant following APAP overdose (A–C) or spontaneously survived (D–F). Biomarker determinations were calculated from a blood sample obtained on day 1 of study admittance and then at 24hr intervals. Baselines for each biomarker in healthy controls are given in table one for comparison.
Fig. 4
Fig. 4. Receiver operator characteristic (ROC) curve analysis for the prediction of patient outcome or prognosis by the quantification of HMGB1 and K18 molecular forms
Receiver Operating Characteristic (ROC) curve analysis for the assessment of circulating total HMGB1 (green), necrosis FL-K18 (purple), acetylated HMGB1 (yellow) and ALT activity (blue) as predicative indicators of APAP ALI patients that (A) reached the KCC (reference standard) or (B) died/required a liver transplant (D/LT) (reference standard) following APAP overdose. Area under the curve (AUC) for each biomarker is indicated on each figure. Combined data set from the UK and USA cohorts for biomarker determinations calculated from a blood sample obtained on day 1 or admittance into the study/presentation at the respective unit. Number of individuals in each subcategory is given in table 2 when required. Statistical significance for all values was p <0.001. Apart from ALT, p = 0.4038 for both A and B.

Comment in

References

    1. Ostapowicz G, Fontana RJ, Schiodt FV, Larson A, Davern TJ, Han SH, et al. Results of a prospective study of acute liver failure at 17 tertiary care centers in the United States. Ann Intern Med. 2002;137(12):947–954. - PubMed
    1. Starkey Lewis P, Dear J, Platt V, Simpson K, Craig D, Antoine D, et al. Circulating microRNAs as potential markers of human drug induced liver injury. Hepatology. 2011;54:1767–1776. - PubMed
    1. Antoine DJ, Williams DP, Kipar A, Jenkins RE, Sathish JG, Regan SL, et al. High Mobility Group Box-1 protein and Keratin-18, circulating serum proteins informative of acetaminophen-induced necrosis and apoptosis in vivo. Toxicological Sciences. 2009;112(2):521–531. - PubMed
    1. Antoine DJ, Williams DP, Kipar A, Laverty H, Park BK. Diet Restriction Inhibits Apoptosis and HMGB1 Oxidation and Promotes Inflammatory Cell Recruitment during Acetaminophen Hepatotoxicity. Molecular Medicine. 2010;16(11–12):479–490. - PMC - PubMed
    1. Craig DG, Lee P, Pryde EA, Masterton GS, Hayes PC, Simpson KJ. Circulating apoptotic and necrotic cell death markers in patients with acute liver injury. Liver Int. 2011 doi: 10.1111/j.1478-3231.2011.02528. - DOI - PubMed

Publication types