MATS: a Bayesian framework for flexible detection of differential alternative splicing from RNA-Seq data
- PMID: 22266656
- PMCID: PMC3333886
- DOI: 10.1093/nar/gkr1291
MATS: a Bayesian framework for flexible detection of differential alternative splicing from RNA-Seq data
Abstract
Ultra-deep RNA sequencing has become a powerful approach for genome-wide analysis of pre-mRNA alternative splicing. We develop MATS (multivariate analysis of transcript splicing), a bayesian statistical framework for flexible hypothesis testing of differential alternative splicing patterns on RNA-Seq data. MATS uses a multivariate uniform prior to model the between-sample correlation in exon splicing patterns, and a Markov chain Monte Carlo (MCMC) method coupled with a simulation-based adaptive sampling procedure to calculate the P-value and false discovery rate (FDR) of differential alternative splicing. Importantly, the MATS approach is applicable to almost any type of null hypotheses of interest, providing the flexibility to identify differential alternative splicing events that match a given user-defined pattern. We evaluated the performance of MATS using simulated and real RNA-Seq data sets. In the RNA-Seq analysis of alternative splicing events regulated by the epithelial-specific splicing factor ESRP1, we obtained a high RT-PCR validation rate of 86% for differential exon skipping events with a MATS FDR of <10%. Additionally, over the full list of RT-PCR tested exons, the MATS FDR estimates matched well with the experimental validation rate. Our results demonstrate that MATS is an effective and flexible approach for detecting differential alternative splicing from RNA-Seq data.
Figures


 alternative hypothesis is that the difference in the exon inclusion levels between two samples is above the user-defined cutoff
  (the white area). The
  null hypothesis is that the difference is below the user-defined cutoff
  (the gray area). (B) MATS can test the extreme ‘switch-like’ differential alternative splicing pattern with a different hypothesis. The
  alternative hypothesis is that the exon inclusion level is below a user-defined threshold
  in sample 1 and above 1-
 in sample 2, or vice versa (the white area). The
  null hypothesis is outside the alternative hypothesis region (the gray area).
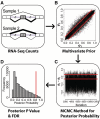
 . (C) The MCMC estimate of the correlation parameter
  can capture the correlation pattern in the data. For the ESRP data,
  is 0.93 (the red vertical line). For the 10 000 simulated data sets from independent uniform priors,
  is distributed close to zero.
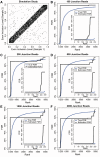
 ) and 5% are simulated from the alternative hypothesis (
 ). (B–F) MATS FDR estimates on simulated data with the exon inclusion levels from (A) and the total junction count per exon and sample as 100 (B), 200 (C), 500 (D), 1000 (E) and 2000 (F). In each panel, exons are rank sorted by MATS FDR estimates in ascending order. The zoomed-in figure shows the FDR estimates of the top 250 exons by MATS.
 is fixed at 0 (i.e. independent prior), and the Fisher exact test. MATS significantly outperforms the other two methods based on the AUC of the ROC curve (i.e. the true positive rate versus false positive rate plot).

Similar articles
-
rMATS: robust and flexible detection of differential alternative splicing from replicate RNA-Seq data.Proc Natl Acad Sci U S A. 2014 Dec 23;111(51):E5593-601. doi: 10.1073/pnas.1419161111. Epub 2014 Dec 5. Proc Natl Acad Sci U S A. 2014. PMID: 25480548 Free PMC article.
-
Identifying differential alternative splicing events from RNA sequencing data using RNASeq-MATS.Methods Mol Biol. 2013;1038:171-9. doi: 10.1007/978-1-62703-514-9_10. Methods Mol Biol. 2013. PMID: 23872975
-
Gene expression and splicing alterations analyzed by high throughput RNA sequencing of chronic lymphocytic leukemia specimens.BMC Cancer. 2015 Oct 16;15:714. doi: 10.1186/s12885-015-1708-9. BMC Cancer. 2015. PMID: 26474785 Free PMC article.
-
PrimerSeq: Design and visualization of RT-PCR primers for alternative splicing using RNA-seq data.Genomics Proteomics Bioinformatics. 2014 Apr;12(2):105-9. doi: 10.1016/j.gpb.2014.04.001. Epub 2014 Apr 18. Genomics Proteomics Bioinformatics. 2014. PMID: 24747190 Free PMC article.
-
Transcriptomic analysis of PNN- and ESRP1-regulated alternative pre-mRNA splicing in human corneal epithelial cells.Invest Ophthalmol Vis Sci. 2013 Jan 23;54(1):697-707. doi: 10.1167/iovs.12-10695. Invest Ophthalmol Vis Sci. 2013. PMID: 23299472 Free PMC article.
Cited by
-
Practical aspects of NGS-based pathways analysis for personalized cancer science and medicine.Oncotarget. 2016 Aug 9;7(32):52493-52516. doi: 10.18632/oncotarget.9370. Oncotarget. 2016. PMID: 27191992 Free PMC article. Review.
-
A cell-based systems biology assessment of human blood to monitor immune responses after influenza vaccination.PLoS One. 2015 Feb 23;10(2):e0118528. doi: 10.1371/journal.pone.0118528. eCollection 2015. PLoS One. 2015. PMID: 25706537 Free PMC article.
-
RNA sequencing of cancer reveals novel splicing alterations.Sci Rep. 2013;3:1689. doi: 10.1038/srep01689. Sci Rep. 2013. PMID: 23604310 Free PMC article.
-
Splicing factor ESRP1 controls ER-positive breast cancer by altering metabolic pathways.EMBO Rep. 2019 Feb;20(2):e46078. doi: 10.15252/embr.201846078. Epub 2019 Jan 21. EMBO Rep. 2019. PMID: 30665944 Free PMC article.
-
Alternative Splicing Variation: Accessing and Exploiting in Crop Improvement Programs.Int J Mol Sci. 2023 Oct 15;24(20):15205. doi: 10.3390/ijms242015205. Int J Mol Sci. 2023. PMID: 37894886 Free PMC article. Review.
References
-
- Keren H, Lev-Maor G, Ast G. Alternative splicing and evolution: diversification, exon definition and function. Nat. Rev. Genet. 2010;11:345–355. - PubMed
-
- Graveley BR. Alternative splicing: increasing diversity in the proteomic world. Trends Genet. 2001;17:100–107. - PubMed
-
- Pan Q, Shai O, Lee LJ, Frey BJ, Blencowe BJ. Deep surveying of alternative splicing complexity in the human transcriptome by high-throughput sequencing. Nat. Genet. 2008;40:1413–1415. - PubMed
Publication types
MeSH terms
Substances
Grants and funding
LinkOut - more resources
Full Text Sources
Other Literature Sources
Molecular Biology Databases

