. 2012 Mar 21;31(6):1494-505.
doi: 10.1038/emboj.2011.500. Epub 2012 Jan 20.

Myeloid translocation gene 16 is required for maintenance of haematopoietic stem cell quiescence

Affiliations

Myeloid translocation gene 16 is required for maintenance of haematopoietic stem cell quiescence

Melissa A Fischer et al. EMBO J. .

Abstract

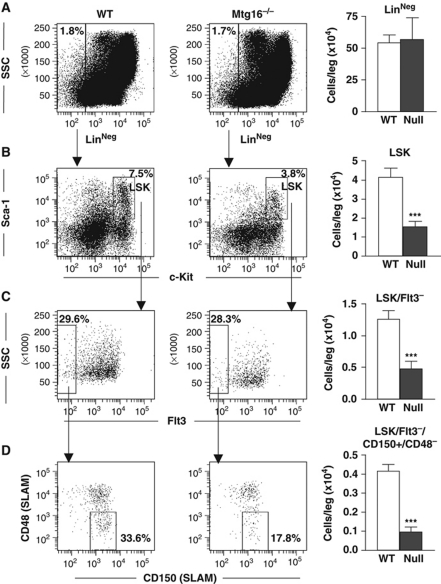
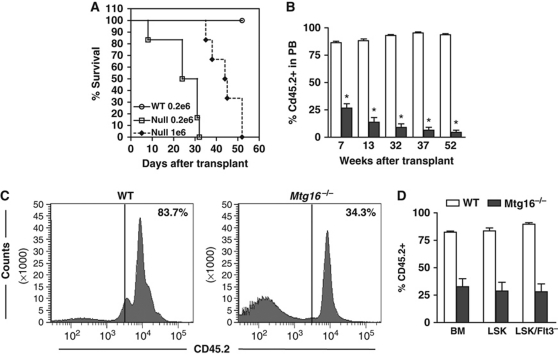
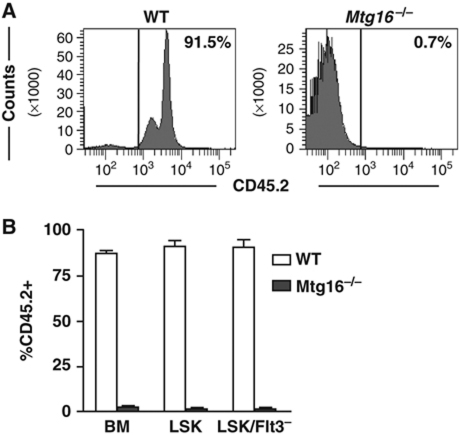
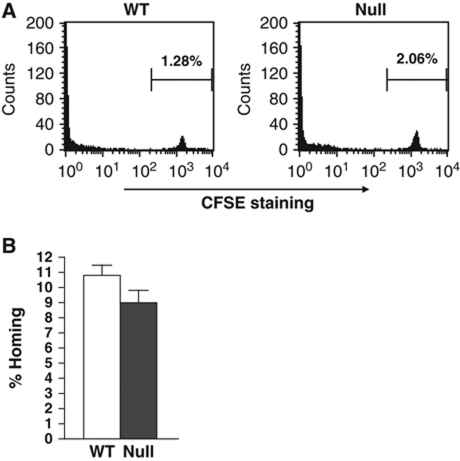
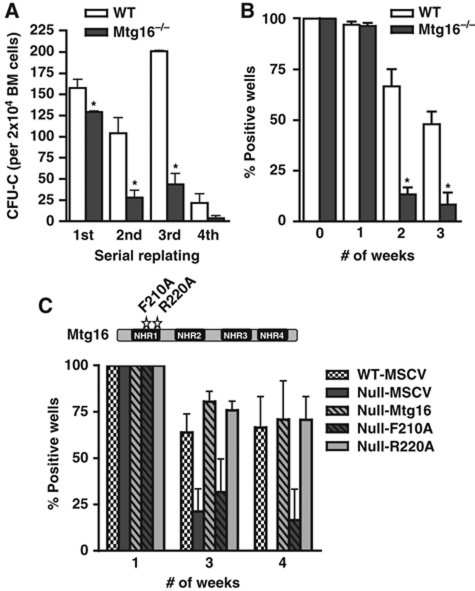
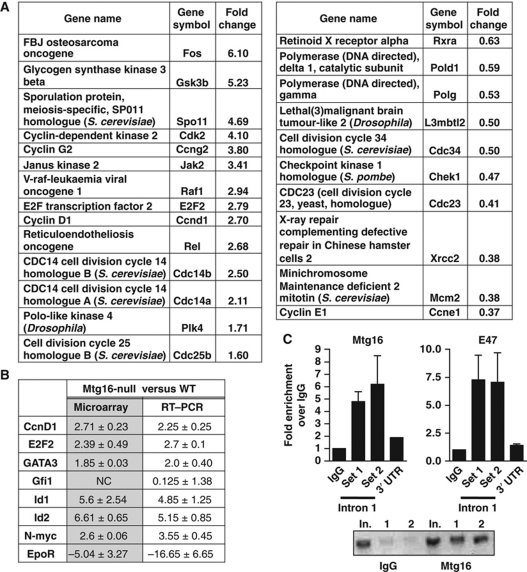
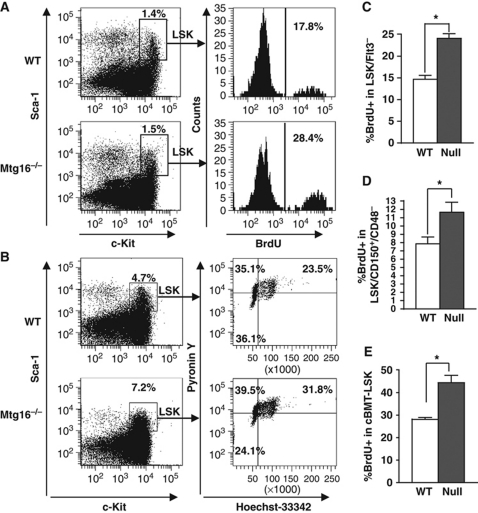
The t(8;21) and t(16;21) that are associated with acute myeloid leukaemia disrupt two closely related genes termed Myeloid Translocation Genes 8 (MTG8) and 16 (MTG16), respectively. Many of the transcription factors that recruit Mtg16 regulate haematopoietic stem and progenitor cell functions and are required to maintain stem cell self-renewal potential. Accordingly, we found that Mtg16-null bone marrow (BM) failed in BM transplant assays. Moreover, when removed from the animal, Mtg16-deficient stem cells continued to show defects in stem cell self-renewal assays, suggesting a requirement for Mtg16 in this process. Gene expression analysis indicated that Mtg16 was required to suppress the expression of several key cell-cycle regulators including E2F2, and chromatin immunoprecipitation assays detected Mtg16 near an E2A binding site within the first intron of E2F2. BrdU incorporation assays indicated that in the absence of Mtg16 more long-term stem cells were in the S phase, even after competitive BM transplantation where normal stem and progenitor cells are present, suggesting that Mtg16 plays a role in the maintenance of stem cell quiescence.


Conflict of interest statement

The authors declare that they have no conflict of interest.

Figures

Figure 1
Figure 1
Inactivation of Mtg16 decreases HSC numbers. Quantification of flow cytometry of whole bone marrow cells. Lineage-negative cells were gated (A) and further analysed using anti-Sca-1 and anti-c-Kit (B; LSK). The LSK cells were further fractionated using anti-Flt3 to obtain the LSK/Flt3 (C), which was further divided using anti-CD150/anti-CD48 to identify the LSK/Flt3/CD150+/CD48 populations (D). Quantification of each of these populations is calculated for the number of cells per leg (femur+tibia) and is shown to the right of each dot plot (wild type n=5, empty bars; Mtg16-null n=5, full bars). Data are expressed as mean±the standard error of the mean (s.e.m.). An unpaired two-tailed t-test indicated that the changes observed in the number of cells were significant (***P⩽0.0001).
Figure 2
Figure 2
Inactivation of Mtg16 disrupts HSC functions. (A) Survival curves of a representative transplant experiment using 200 000 wild-type bone marrow (BM) cells (open circles), 200 000 Mtg16-null BM cells (open boxes), or 1 000 000 Mtg16-null bone marrow cells (filled diamonds). (B) Competitive repopulation assay where 90% control (empty bars) or Mtg16-null (filled bars) CD45.2+ BM cells were co-injected with 10% wild-type CD45.1+ cells. The contribution of each population to long-term reconstitution of the BM was assessed by flow cytometry using anti-CD45.1 and anti-CD45.2 to enumerate cells in the peripheral blood. Data are expressed as mean±s.e.m. at different times after transplantation. An unpaired two-tailed t-test indicated these differences (marked by an *) were statistically significant at all time points after transplantation (P<0.0001; n=5). (C) Flow cytometry analysis of whole BM to determine the percentage of CD45.2 that had repopulated the bone marrow 12 weeks after a competitive repopulation assay. A representative plot from an experiment performed in triplicate that is consistent with other biological replicates is shown. (D) Graphical representation of the quantification of CD45.2 cells residing in the BM and LSK or LSK/Flt3 compartments 12 weeks after competitive BM transplantation.
Figure 3
Figure 3
Serial transplantation reveals requirements for Mtg16 in the maintenance of stem cells. (A) Flow cytometry analysis of whole bone marrow to determine the percentage of CD45.2 that had repopulated the bone marrow (BM) 6 weeks after secondary bone marrow transplantation from an initial competitive repopulation assay. A representative plot from an experiment performed in triplicate that is consistent with other biological replicates is shown. (B) Graphical representation of the quantification of CD45.2 cells residing in the BM and LSK or LSK/Flt3 compartments 6 weeks after secondary BM transplantation.
Figure 4
Figure 4
Mtg16−/− cells home to the bone marrow. (A) Bone marrow from control wild-type and Mtg16−/− mice was stained with CFSE and injected into lethally irradiated recipient mice. The bone marrow was analysed by flow cytometry to identify CFSE-labelled cells. (B) Representative graph of the number of colony-forming cells that homed to the bone marrow 16 h after injection into lethally irradiated recipient mice.
Figure 5
Figure 5
Inactivation of Mtg16 impairs stem cell self-renewal. (A) Graphical representation of the numbers of methylcellulose colonies formed during serial replating assays where 2 × 10⁴ cells were plated every 7 days for 4 weeks (wild type, empty bars; Mtg16-null, full bars). Data are expressed as mean±s.e.m. An unpaired two-tailed t-test indicated these differences were statistically significant (marked by an *; first, P=0.03; second, P=0.01; third, P<0.001; n=4). Representative results from an experiment done in duplicate that are consistent with other biological replicates are shown. (B) Graphical representation of the numbers of methylcellulose colonies formed at the indicated times from LTC-IC cultures of wild-type (open bars) and Mtg16-null (full bars) bone marrow cells. Data are expressed as mean±s.e.m. An unpaired two-tailed t-test indicated the difference at week 2 and week 3 after culture (marked with an *) was statistically significant (P<0.05; n=4). Representative results from three separate experiments are shown. (C) Mtg16 re-expression, but not Mtg16-F210A, complements the LTC-IC defect in Mtg16-null bone marrow cells. Schematic diagram shows the positions of the F210A (blocks Mtg8 binding to HEB and Mtg16 suppression of E protein-dependent transcription) and R220A (control mutation that does not affect E protein binding in the crystal structure of Mtg8) point mutants.
Figure 6
Figure 6
Mtg16-null LSK cells have altered gene expression patterns. (A) Gene expression profiling of mRNA from LSK cells isolated from wild-type and Mtg16-null mice was analysed using cDNA microarrays. Panther ontology analysis was used to group genes into specific biological processes and representative genes associated with cell-cycle control with their relative expression levels when Mtg16 is deleted are shown. (B) Quantitative RT–PCR of selected genes was used to validate the microarray studies. (C) Mtg16 associates with the first intron of E2F2. Chromatin immunoprecipitated with the either control IgG or anti-Mtg16/Eto2 from lysates of MEL cells was amplified with two sets of primers (Set 1 and Set 2) that encompass an E2A binding site in the first intron of E2F2, or as a control, the 3′ untranslated region (UTR) of E2F2 using quantitative PCR. Graph shows the level of signal relative to IgG set to ‘1’. The panel at the right shows ChIP using anti-E47 with the same E2F2 first intron primers. The ethidium bromide-stained agarose gel shows a representative PCR stopped after 30 cycles; In., input; 1 and 2 designate the duplicate PCR samples from the ChIP reaction using primer set #2 flanking the E2A binding site.
Figure 7
Figure 7
Inactivation of Mtg16 leads to a decrease in the number of quiescent LSK cells. (A) Cell-cycle status of LSK cells was analysed using BrdU. A representative FACS plot from an experiment performed with five mice that is consistent with other biological replicates is shown. (B) Cell-cycle status of LSK cells was analysed with the DNA dye Hoechst 33342 (HO) and the RNA dye Pyronin Y (PY). A representative plot from an experiment performed in triplicate that is consistent with other biological replicates is shown. (C) Quantification of the percentage of LSK/Flt3 cells in S phase using BrdU incorporation as described in (A), but incorporating anti-Flt3. Data are expressed as mean±s.e.m. and are consistent with other biological replicates. *An unpaired two-tailed t-test yielded P<0.0001; n=6. (D) Quantification of the percentage of LSK/CD150+/CD48 cells in S phase using BrdU incorporation as described in (A). Data are expressed as mean±s.e.m. and are consistent with other biological replicates. *An unpaired two-tailed t-test yielded P=0.025; wild type, n=7; Mtg16-null, n=8. (E) Quantification of the number of LSK cells in the S phase 5–6 weeks after competitive repopulation was analysed using BrdU as described in (A). Data are expressed as mean±s.e.m. and are from biological replicates. *An unpaired two-tailed t-test yielded CD45.2+, LSK BrdU+, P=0.0069; wild type, n=4; Mtg16-null, n=8.

References

    1. Amann JM, Chyla BJ, Ellis TC, Martinez A, Moore AC, Franklin JL, McGhee L, Meyers S, Ohm JE, Luce KS, Ouelette AJ, Washington MK, Thompson MA, King D, Gautam S, Coffey RJ, Whitehead RH, Hiebert SW (2005) Mtgr1 is a transcriptional corepressor that is required for maintenance of the secretory cell lineage in the small intestine. Mol Cell Biol 25: 9576–9585 - PMC - PubMed
    1. Amann JM, Nip J, Strom DK, Lutterbach B, Harada H, Lenny N, Downing JR, Meyers S, Hiebert SW (2001) ETO, a target of t(8;21) in acute leukemia, makes distinct contacts with multiple histone deacetylases and binds mSin3A through its oligomerization domain. Mol Cell Biol 21: 6470–6483 - PMC - PubMed
    1. Bai X, Kim J, Yang Z, Jurynec MJ, Akie TE, Lee J, LeBlanc J, Sessa A, Jiang H, DiBiase A, Zhou Y, Grunwald DJ, Lin S, Cantor AB, Orkin SH, Zon LI (2010) TIF1gamma controls erythroid cell fate by regulating transcription elongation. Cell 142: 133–143 - PMC - PubMed
    1. Boggs DR (1984) The total marrow mass of the mouse: a simplified method of measurement. Am J Hematol 16: 277–286 - PubMed
    1. Buitenhuis M, van Deutekom HW, Verhagen LP, Castor A, Jacobsen SE, Lammers JW, Koenderman L, Coffer PJ (2005) Differential regulation of granulopoiesis by the basic helix-loop-helix transcriptional inhibitors Id1 and Id2. Blood 105: 4272–4281 - PubMed

Publication types

MeSH terms