. 2012 Mar 2;335(6072):1106-10.
doi: 10.1126/science.1215802. Epub 2012 Jan 19.

Biased signaling pathways in β2-adrenergic receptor characterized by 19F-NMR

Affiliations

Biased signaling pathways in β2-adrenergic receptor characterized by 19F-NMR

Jeffrey J Liu et al. Science. .

Abstract

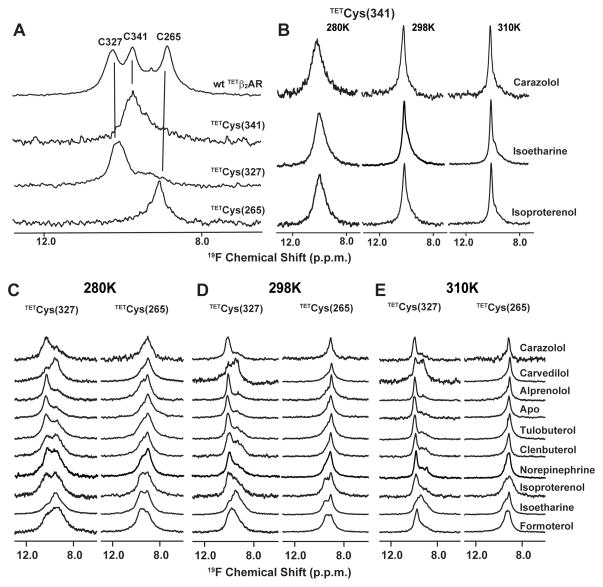
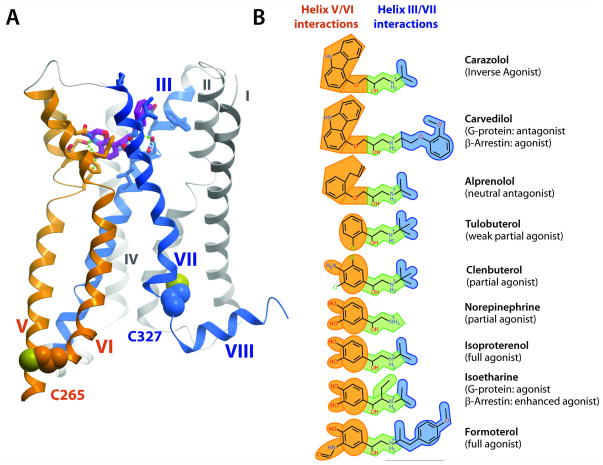
Extracellular ligand binding to G protein-coupled receptors (GPCRs) modulates G protein and β-arrestin signaling by changing the conformational states of the cytoplasmic region of the receptor. Using site-specific (19)F-NMR (fluorine-19 nuclear magnetic resonance) labels in the β(2)-adrenergic receptor (β(2)AR) in complexes with various ligands, we observed that the cytoplasmic ends of helices VI and VII adopt two major conformational states. Changes in the NMR signals reveal that agonist binding primarily shifts the equilibrium toward the G protein-specific active state of helix VI. In contrast, β-arrestin-biased ligands predominantly impact the conformational states of helix VII. The selective effects of different ligands on the conformational equilibria involving helices VI and VII provide insights into the long-range structural plasticity of β(2)AR in partial and biased agonist signaling.


Figures

Fig. 1
Fig. 1
Locations of 19F-NMR labels in β2AR and activation-related changes in GPCR crystal structures. (A) Side view of β2AR in the active G protein-bound form (PDB ID 3SN6, shown in green). The trans-membrane helices I to VII and the C-terminal helix VIII are identified. The full agonist BI-167107 in the ligand-binding site is shown as a stick diagram. Green and yellow spheres highlight the three cysteine residues used for TET labeling, i.e., Cys2656.27 and Cys3277.54 at the cytoplasmic ends of helices VI and VII, respectively and Cys341 at the C-terminus. The bound G-protein heterotrimer is shown as red ribbons and surfaces. (B) Cytoplasmic view of the structure in (A), with the G-protein contact sites outlined by a broken red line. (C) Plot of distance root mean square deviations (RMSD) of individual residues between crystal structures of inactive and active-states of three GPCRs. Crystal structures used (from top to bottom): β2AR (PDB IDs 2RH1 vs. 3SN6), rhodopsin (PDB IDs 1GZM vs. 3DQB), A2A adenosine receptor (A2AAR; PDB IDs 3EML vs. 3QAK). The horizontal axes represent the amino acid sequences (β2AR residues 34–341, bovine rhodopsin residues 38–320, A2AAR residues 6–302). The vertical axis shows all-heavy-atom RMSDs per residue, while the color code defined in the upper right corner of the panel indicates corresponding Cα deviations. For each protein, selected residues are identified (see text). The locations of the helices I to VIII are indicated at the top. Periplasmic loop regions are highlighted in red, while cytoplasmic loops and helix VIII are highlighted in blue. The cytoplasmic ends of helices VI and VII, which contain Cys2656.27 and Cys3277.54, are “hot spots” with large conformational rearrangements between the crystal structures of inactive and active states; other transmembrane helices and intracellular helix VIII, which includes Cys341, show only small displacements.
Fig. 2
Fig. 2
1D 19F-NMR spectra of different TET-labeled β2AR constructs under variable solution conditions. (A) 19F-NMR resonance assignments for carazolol-bound TETβ2AR at 298 K. Spectra of the following constructs were recorded: wt TETβ2AR; β2AR (TETC265, C327S, C341A), β2AR (C265A, TETC327, C341A) and β2AR (C265A, C327S, TETC341). The vertical lines connect peaks in the 19F-NMR spectrum of TETβ2AR with the corresponding peaks in the spectra of the single-residue TET-labeled mutants. At the top, the peak assignments are indicated by the one-letter amino acid code and the residue number. (B) β2AR (C265A, C327S, TETC341) in complex with an inverse agonist (carazolol), a biased agonist (isoetharine), and a full agonist (isoproterenol) at 280K, 298K and 310K. (C), (D) and (E) β2AR (TETC265, C327S, C341A) and β2AR (C265A, TETC327, C341A) free and bound to nine different ligands at 280K, 298K and 310K. In (B) to (E), the temperature and the ligands are indicated at the top and on the right, respectively. For all experiments, the following parameter settings were used to collect and process the spectra: data size 1024 complex points, acquisition time 51 ms, 24576 scans per increment. The data were multiplied with an exponential function with a line-broadening factor of 30 Hz, and zero-filled to 2048 points prior to Fourier transformation.
Fig. 3
Fig. 3
Relative populations of active (A, red) and inactive (I, blue) states of β2AR derived from the 1D 19F-NMR spectra at 280K. (A) Peak volumes for the individual components in the 1D 19F-NMR signals of β2AR (TETC265, C327S, C341A) and β2AR(C265A, TETC327, C341A) obtained by a non-linear least-squares fit to a double-Lorentzian function. The experimental data and the double-Lorentzian are indicated by thin and thick black lines, respectively. The fit used the chemical shift positions of peaks A and I indicated by the red and blue vertical lines. (B) Plot of the relative peak volumes for C265A versus the relative peak volumes for C327A. The relative peak volumes are the ratios of the volume of peak A and the sum of the volumes of peaks A and I. Agonists (tulobuterol, clenbuterol, norepinephrine (NE), isoproterenol, formoterol) are shown as black circles highlighted by a yellow background, biased ligands (carvedilol, isoetharine) as red triangles highlighted by a green background, a neutral antagonist (alprenolol) as a black square, an inverse agonist (carazolol) as a black diamond, and the apo-protein as an open square.
Fig. 4
Fig. 4
Features of ligand binding in the β2AR structure and a conceptual model of signaling pathways to G-proteins and arrestins in β2AR activation. (A) Side view of the structure of active-state β2AR in the complex with the agonist BI-167107 (PDB ID 3SN6), with helices V/VI and III/VII color-coded orange and blue, respectively, to indicate that they interact with the correspondingly colored fragments of the ligands in (B). (B) Chemical structures of the ligands used in the current 19F-NMR studies. Orange highlights the head groups, green the common ethanolamine moieties and blue the substituents to the amino group of the ethanolamine tail. Ligand names are shown on the right, with published pharmacological efficacy indicated in parentheses.

Comment in

References

    1. Hopkins AL, Groom CR. The druggable genome. Nat Rev Drug Discov. 2002;1:727. - PubMed
    1. Rajagopal K, Lefkowitz RJ, Rockman HA. When 7 transmembrane receptors are not G protein-coupled receptors. J Clin Invest. 2005;115:2971. - PMC - PubMed
    1. Shenoy SK, Lefkowitz RJ. beta-arrestin-mediated receptor trafficking and signal transduction. Trends Pharmacol Sci. 2011;32:521. - PMC - PubMed
    1. Drake MT, et al. beta-arrestin-biased agonism at the beta2-adrenergic receptor. J Biol Chem. 2008;283:5669. - PubMed
    1. Urban JD, et al. Functional selectivity and classical concepts of quantitative pharmacology. J Pharmacol Exp Ther. 2007;320:1. - PubMed

Publication types

MeSH terms