

doi: 10.1074/jbc.M111.310136.
Epub 2012 Jan 20.
Biochemical inhibition of the acetyltransferases ATase1 and ATase2 reduces β-secretase (BACE1) levels and Aβ generation
Affiliations
- PMID: 22267734
- PMCID: PMC3318698
- DOI: 10.1074/jbc.M111.310136
Item in Clipboard
Biochemical inhibition of the acetyltransferases ATase1 and ATase2 reduces β-secretase (BACE1) levels and Aβ generation
J Biol Chem.
.
Abstract
The cellular levels of β-site APP cleaving enzyme 1 (BACE1), the rate-limiting enzyme for the generation of the Alzheimer disease (AD) amyloid β-peptide (Aβ), are tightly regulated by two ER-based acetyl-CoA:lysine acetyltransferases, ATase1 and ATase2. Here we report that both acetyltransferases are expressed in neurons and glial cells, and are up-regulated in the brain of AD patients. We also report the identification of first and second generation compounds that inhibit ATase1/ATase2 and down-regulate the expression levels as well as activity of BACE1. The mechanism of action involves competitive and non-competitive inhibition as well as generation of unstable intermediates of the ATases that undergo degradation.
Figures

ATase1 and ATase2 are expressed in neurons.
A, Western blot assessment of CHO cells overexpressing human ATase1 and/or ATase2. Left panel: anti-ATase1/ATase2 antibody; right panel: anti-Myc antibody. Lane 1, control (non transfected) cells; lane 2, stable overexpression of ATase1; lane 3, stable overexpression of ATase2; lane 4, stable overexpression of both ATase1 and ATase2. B, Western blot showing the endogenous levels of ATase1 and ATase2 in different cellular systems. The right panel shows higher exposure of the same image. Lane 1, CHO cells; lane 2, H4 cells; lane 3, SH-SY5Y cells; lane 4, SHEP cells; lane 5, PC-12 cells; lane 6, mouse primary neurons (day 3 in culture); lane 7, mouse primary neurons (day 18 in culture); lane 8; whole mouse brain extract (cortex). Asterisks (*) indicates a background band that migrates immediately above the 28-kDa marker. C, ATase1/ATase2 immunolabeling in different brain areas of control/non-transgenic (Non-Tg) and p44+/+ transgenic (p44+/+) mice. Panels g, h, and i correspond to higher magnification images of the areas indicated in d, e, and f, respectively. Cortex, frontal cortex; CA1, cornu ammonis (area 1), DG, dentate gyrus. Bar in f, 50 μm; bar in i, 50 μm.

ATase1 and ATase2 are up-regulated in the brain of AD patients.
A, ATase1/ATase2 immunolabeling in the dentate gyrus and cornu ammonis of control human brain. Panel c corresponds to a higher magnification image of the area indicated in panel b. Bar in b, 50 μm; bar in c, 25 μm. Panel c shows co-labeling of ATase1/ATase2 (green) and NeuN (neuronal marker; red). Asterisk (*) in panel c points to a single glial cell. B, ATase1/ATase2 immunolabeling in different brain areas of AD patients and age-matched controls (NL). DG, dentate gyrus; CA, cornu ammonis; FC, frontal cortex. Panels k, l, m, n, and o correspond to higher magnification images of the areas indicated in f, g, h, i, and j, respectively. Bar in j, 50 μm; bar in o, 25 μm. Asterisks (*) in panels i and n point to isolated glial cells. C, Western blot showing increased levels of ATase1 in the brain (frontal cortex) of AD patients. Lanes are labeled as N (for normal) and A (for AD). D, cDNA produced from the frontal cortex of late-onset AD patients (n = 10; average age: 70; age range: 60–91) and age-matched controls (n = 10; average age: 68; age range: 57–80) was analyzed by quantitative real-time PCR. Results were normalized against GAPDH levels and are expressed as percent of age-matched controls + S.E.; **, p < 0.005. Grading of AD patients is shown in supplemental Table S1 .

Inhibition kinetics of compound 9 and 19.
A, schematic representation of the chemical and structural features of compound 9 and 19. B and C, Lineweaver-Burke plots for compound 9 (B) and 19 (C). Results are the mean of at least six independent determinations ± S.D.
Compounds 9 and 19 decrease the endogenous levels of BACE1.
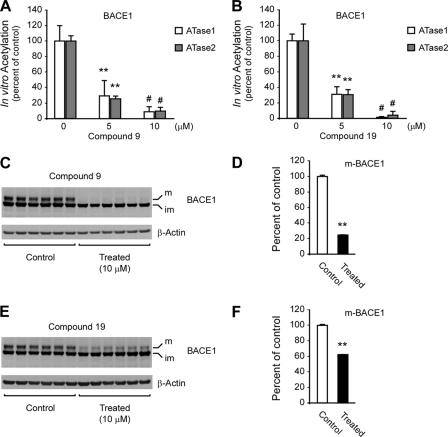
A and B, affinity-purified ATases and BACE1 were co-incubated in the presence of [3H]Acetyl-CoA and increasing concentrations of compound 9 (A) or 19 (B). For the determination of [3H] incorporation, BACE1 was purified prior to scintillation liquid counting. The transfer activity of ATase1 and ATase2 in the absence of inhibitors was 3.05 ± 0.2 and 4.48 ± 0.3 nmol/h/mg of enzyme, respectively. Results are the mean (n = 3) + S.D.; **, p < 0.005; #, p < 0.0005. C–F, H4 cells were treated with either compound 9 or 19 for 48 h prior to Western blot assessment of BACE1 levels in total cell lysates (C–F). Representative Western blots are shown in C and E while respective quantifications are shown in D and F. Both mature (m) and immature (im) BACE1 are shown.

Compounds 9 and 19 decrease levels and activity of BACE1. H4 cells were treated with either compound 9 or 19 for 48 h prior to ELISA determination of secreted Aβ (A), and Western blot assessment of C99 (B) and αsAPP/βsAPP levels (C). C99 and βsAPP are the immediate products of BACE1-mediated cleavage of APP while αsAPP is the product of the α cleavage of APP. Both mature (m) and immature (im) BACE1 are shown. Aβ results are the mean (n = 6) + S.D.; **, p < 0.005.

Compounds 9 and 19 do not affect the lysine acetylation profile of cytosolic or nuclear proteins.
A and B, H4 cells were treated with either compound 9 or 19 for 48 h prior to Western blot assessment of the acetylation profile of cytosolic (A) and nuclear (B) proteins. C, The nuclear fraction used in (B) was also used to assess the lysine acetylation profile of the histone proteins H3 and H4. α-PCNA (B) also serves as loading control for C.

Effect of compound 9 and derivatives on ATase1 and ATase2 levels.
A, H4 cells were treated with the indicated compounds (10 μm ) for 48 h prior to Western blot assessment of BACE1 and ATase1/ATase2 levels in total cell lysates. B, D, and E, quantification of changes are expressed as percent of control (vehicle) and are the mean (n = 3) + S.D.; *, p < 0.05; **, p < 0.005; #, p < 0.0005. C, ELISA determination of secreted Aβ in the conditioned media of the experiment described in A. Results are expressed as percent of control (vehicle) and are the mean (n = 3) + S.D.; *, p < 0.05; **, p < 0.005.

Compound 9 causes the degradation of ATase1 and ATase2.
A–D, H4 cells were treated with increasing concentrations of compound 9 for 48 h prior to Western blot assessment of BACE1 and ATase1/ATase2 levels in total cell lysates. B–D, quantification of changes are expressed as percent of control (vehicle) and are the mean (n = 3) + S.D.; *, p < 0.05; **, p < 0.005; #, p < 0.0005. Both mature (m) and immature (im) BACE1 are shown. E and F, CHO cells overexpressing either ATase1 or ATase2 were treated with 10 μm compound 9 (E) or 19 (F) for 48 h prior to Western blot assessment of ATase1 and ATase2 levels in total cell lysates.

Compound 9 causes conformational changes of ATase1 and ATase2.
A and B, circular dichroism spectra of affinity-purified ATase1 and ATase2 in the presence or absence of 10 μm compound 9 (A) or compound 19 (B).
References
-
- Lambert M. P., Barlow A. K., Chromy B. A., Edwards C., Freed R., Liosatos M., Morgan T. E., Rozovsky I., Trommer B., Viola K. L., Wals P., Zhang C., Finch C. E., Krafft G. A., Klein W. L. (1998) Diffusible, nonfibrillar ligands derived from Aβ1–42 are potent central nervous system neurotoxins. Proc. Natl. Acad. Sci. U.S.A. 95, 6448–6453 - PMC - PubMed
-
- Klein W. L., Krafft G. A., Finch C. E. (2001) Targeting small Aβ oligomers: the solution to an Alzheimer disease conundrum? Trends Neurosci. 24, 219–224 - PubMed
-
- Haass C., Steiner H. (2001) Protofibrils, the unifying toxic molecule of neurodegenerative disorders? Nat. Neurosci. 4, 859–860 - PubMed
Publication types
MeSH terms
Substances
Grants and funding
LinkOut - more resources
Full Text Sources
Other Literature Sources
Medical
Molecular Biology Databases
