. 2012 Mar 9;287(11):8013-20.
doi: 10.1074/jbc.M111.298414. Epub 2012 Jan 20.

Structural determinants of Clostridium difficile toxin A glucosyltransferase activity

Affiliations

Structural determinants of Clostridium difficile toxin A glucosyltransferase activity

Rory N Pruitt et al. J Biol Chem. .

Abstract

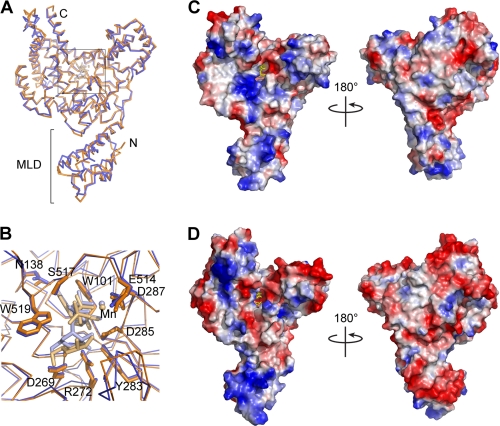
The principle virulence factors in Clostridium difficile pathogenesis are TcdA and TcdB, homologous glucosyltransferases capable of inactivating small GTPases within the host cell. We present crystal structures of the TcdA glucosyltransferase domain in the presence and absence of the co-substrate UDP-glucose. Although the enzymatic core is similar to that of TcdB, the proposed GTPase-binding surface differs significantly. We show that TcdA is comparable with TcdB in its modification of Rho family substrates and that, unlike TcdB, TcdA is also capable of modifying Rap family GTPases both in vitro and in cells. The glucosyltransferase activities of both toxins are reduced in the context of the holotoxin but can be restored with autoproteolytic activation and glucosyltransferase domain release. These studies highlight the importance of cellular activation in determining the array of substrates available to the toxins once delivered into the cell.


Figures

FIGURE 1.
FIGURE 1.
Structure of the TcdA GTD. A–C, the UDP-glucose-bound TcdA GTD is shown with the core GT-A family fold in blue and the α-helical protrusions from the fold in green. The mobile 516–522 loop is in yellow, and the loop from the apo structure is superimposed on the structure in pink. Ser-517, Trp-519, and UDP-glucose are represented as sticks. B, a close-up view of the 516–522 loop; C, a “top” view (rotated 90° from the “front” view shown in A).
FIGURE 2.
FIGURE 2.
Comparison of the TcdA and TcdB GTD structures. The structures of the domains are similar in their overall architecture with a root mean square deviation of 1.6 Å for the α-carbon backbone. A, the aligned structures of the TcdA (blue) and TcdB (orange) GTDs are shown as backbone traces. B, a close-up view of the catalytic site with UDP-glucose coordinating residues shown as sticks. UDP-glucose (light blue), UDP (light orange), and glucose (light orange) are also shown as sticks. Manganese ions are shown as small spheres. Although the cores of the GTDs are conserved, the surfaces are highly divergent (C and D). The electrostatic surface potentials of the TcdA GTD (C) and the TcdB GTD (D) are shown with positively charged surfaces colored blue and negatively charged surfaces in red. The coordinated glyconucleosides are shown as yellow sticks.
FIGURE 3.
FIGURE 3.
Glucosyltransferase activity of the TcdA and TcdB GTDs. TcdA and TcdB GTDs (0.1 nm) were tested for their ability to glucosylate a panel of GTPases (2 μm) over the course of 1 h using UDP-[14C]glucose (24 μm) as a co-substrate. The band intensities for the representative experiments shown in the insets were quantified by densitometry. The means ± S.D. from three independent replicates are shown with TcdA in circles and TcdB in triangles. The data are scaled with the average value for Cdc42 modified by TcdA GTD set at 1.
FIGURE 4.
FIGURE 4.
Inhibition of glucosyltransferase activity in the holotoxin. Recombinant Cdc42 (2 μm) was incubated with UDP-[14C]glucose (24 μm) and the indicated toxin or toxin fragment (0.1 nm each) for 1 h. The proteins were resolved by SDS-PAGE, and the gels were analyzed by phosphorimaging. A, comparison of GTD and HT activity of TcdA (gray bars) and TcdB (white bars) (n = 4). Activity is inhibited in the holotoxins. B, TcdA GTD(1–542), TcdA(1–800), TcdA(1–1832), and TcdA HT(1–2710) were tested for their capacity to modify Cdc42 (n = 3). The activity of the 1–800, 1–1832, and 1–2710 proteins was reduced relative to GTD but was increased after induction of autoprocessing. Band intensities were quantified, and the data were scaled with the average value for Cdc42 modified by TcdA GTD set at 1. Error bars, S.D. Insets show representative experiments.
FIGURE 5.
FIGURE 5.
Structure of the TcdA GTD alone and in the context of the TcdA holotoxin structure. A–C, three-dimensional reconstruction of TcdA (32) filtered to 25 Å is shown as a mesh surface with the crystal structure of the TcdA GTD (blue) and a model of the TcdA RBD (52) (green) placed into the density. UDP-glucose is shown as yellow spheres. In C, the model of the binding domain and the corresponding map density are removed. D, surface of the TcdA GTD shown in the same orientation as in C. The core GT-A fold is shown in blue with the additional α-helical regions in green (as in Fig. 1). The 516–522 loop is colored red, and UDP-glucose is represented as yellow spheres. Amino acids Lys-448, Gln-454, Glu-460, Arg-462, and Gly-471 are shown in purple. The corresponding residues in TcdB have been shown to be involved in substrate binding (45).
FIGURE 6.
FIGURE 6.
Inactivation of Rap2A in cells treated with TcdA. HeLa or Caco2 cells were treated with buffer, 10 nm TcdA, or 0.1 nm TcdB for 2 h. Activated Rap2A was pulled down from the cell lysates using RalGDS-RBD and detected by Western blot.
FIGURE 7.
FIGURE 7.
Glucosylation of Rap2A in cells treated with TcdA. A–E, MALDI-TOF/TOF mass spectrometry indicating the glucosylation of the peptide YDPTIEDFYR. A–C, a portion of the MALDI-TOF peptide mass map (m/z 1013–1825) is shown to highlight the diagnostic singly charged peptide ions at m/z 1318.60 and 1480.65 (labeled in boldface type) that represent the peptide in the native and glucosylated state, respectively. The m/z 1480.65 is only found in the TcdA-treated samples (B). MALDI-TOF/TOF fragmentation spectra are shown for the m/z 1318.60 peptide (D) and for the glucosylated m/z 1480.65 form (E). Labeled y ions are denoted by cleavage brackets below the sequence. The y8 fragment ion that contains Thr-35 is diagnostic for the modification, which adds 162 Da. Ions are also observed that are consistent with neutral loss of glucose from the y8 and M + H ions.

References

    1. Lyras D., O'Connor J. R., Howarth P. M., Sambol S. P., Carter G. P., Phumoonna T., Poon R., Adams V., Vedantam G., Johnson S., Gerding D. N., Rood J. I. (2009) Toxin B is essential for virulence of Clostridium difficile. Nature 458, 1176–1179 - PMC - PubMed
    1. Kuehne S. A., Cartman S. T., Heap J. T., Kelly M. L., Cockayne A., Minton N. P. (2010) The role of toxin A and toxin B in Clostridium difficile infection. Nature 467, 711–713 - PubMed
    1. Hofmann F., Busch C., Prepens U., Just I., Aktories K. (1997) Localization of the glucosyltransferase activity of Clostridium difficile toxin B to the N-terminal part of the holotoxin. J. Biol. Chem. 272, 11074–11078 - PubMed
    1. Rupnik M., Pabst S., Rupnik M., von Eichel-Streiber C., Urlaub H., Söling H. D. (2005) Characterization of the cleavage site and function of resulting cleavage fragments after limited proteolysis of Clostridium difficile toxin B (TcdB) by host cells. Microbiology 151, 199–208 - PubMed
    1. von Eichel-Streiber C., Sauerborn M. (1990) Clostridium difficile toxin A carries a C-terminal repetitive structure homologous to the carbohydrate binding region of streptococcal glycosyltransferases. Gene 96, 107–113 - PubMed

Publication types

MeSH terms