

Quantitative high-throughput screening for chemical toxicity in a population-based in vitro model
- PMID: 22268004
- PMCID: PMC3307611
- DOI: 10.1093/toxsci/kfs023
Quantitative high-throughput screening for chemical toxicity in a population-based in vitro model
Abstract
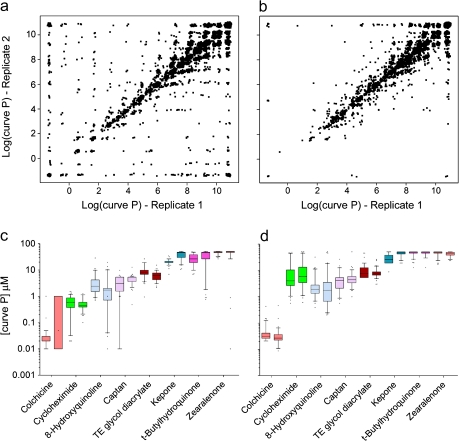
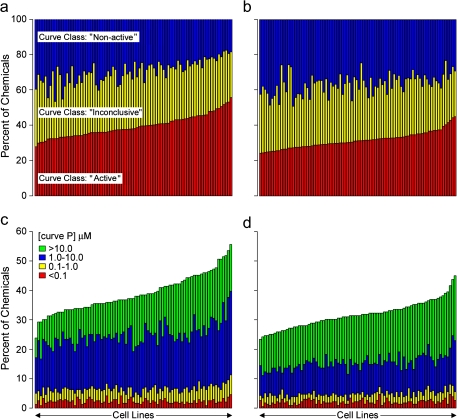
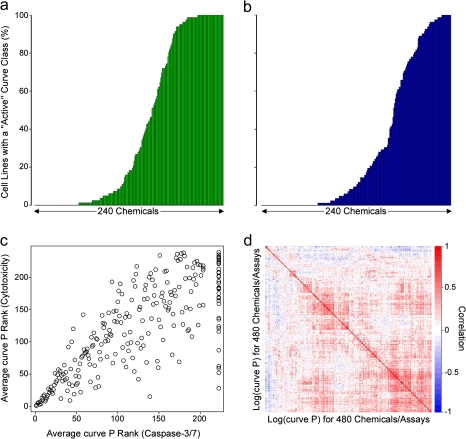
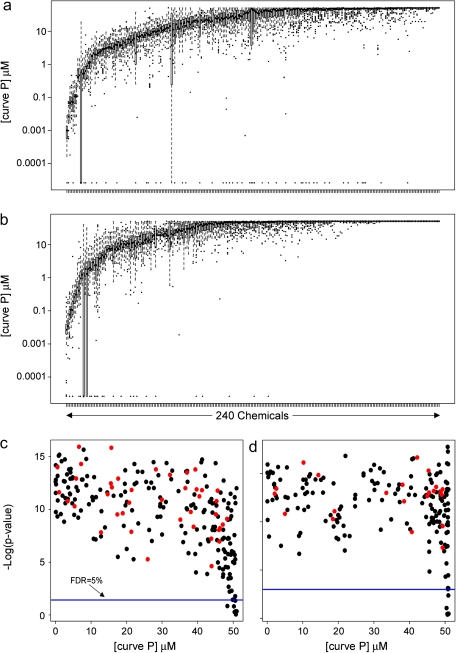
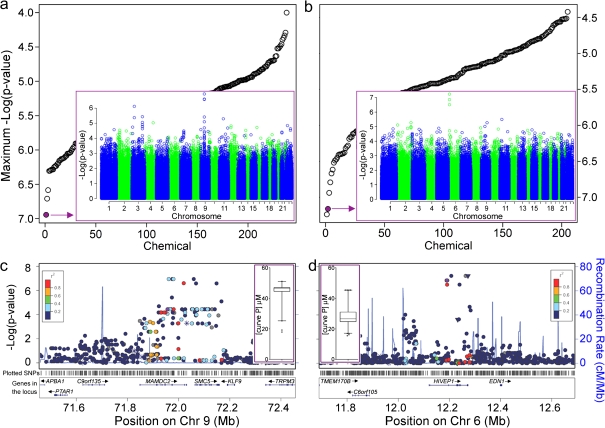
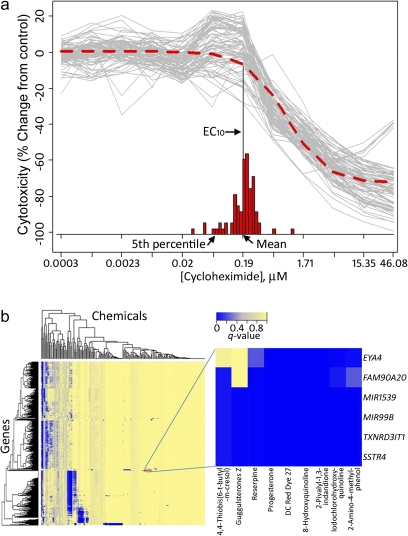
A shift in toxicity testing from in vivo to in vitro may efficiently prioritize compounds, reveal new mechanisms, and enable predictive modeling. Quantitative high-throughput screening (qHTS) is a major source of data for computational toxicology, and our goal in this study was to aid in the development of predictive in vitro models of chemical-induced toxicity, anchored on interindividual genetic variability. Eighty-one human lymphoblast cell lines from 27 Centre d'Etude du Polymorphisme Humain trios were exposed to 240 chemical substances (12 concentrations, 0.26nM-46.0μM) and evaluated for cytotoxicity and apoptosis. qHTS screening in the genetically defined population produced robust and reproducible results, which allowed for cross-compound, cross-assay, and cross-individual comparisons. Some compounds were cytotoxic to all cell types at similar concentrations, whereas others exhibited interindividual differences in cytotoxicity. Specifically, the qHTS in a population-based human in vitro model system has several unique aspects that are of utility for toxicity testing, chemical prioritization, and high-throughput risk assessment. First, standardized and high-quality concentration-response profiling, with reproducibility confirmed by comparison with previous experiments, enables prioritization of chemicals for variability in interindividual range in cytotoxicity. Second, genome-wide association analysis of cytotoxicity phenotypes allows exploration of the potential genetic determinants of interindividual variability in toxicity. Furthermore, highly significant associations identified through the analysis of population-level correlations between basal gene expression variability and chemical-induced toxicity suggest plausible mode of action hypotheses for follow-up analyses. We conclude that as the improved resolution of genetic profiling can now be matched with high-quality in vitro screening data, the evaluation of the toxicity pathways and the effects of genetic diversity are now feasible through the use of human lymphoblast cell lines.
Figures
Similar articles
-
In vitro screening for population variability in chemical toxicity.Toxicol Sci. 2011 Feb;119(2):398-407. doi: 10.1093/toxsci/kfq322. Epub 2010 Oct 15. Toxicol Sci. 2011. PMID: 20952501 Free PMC article.
-
Compound cytotoxicity profiling using quantitative high-throughput screening.Environ Health Perspect. 2008 Mar;116(3):284-91. doi: 10.1289/ehp.10727. Environ Health Perspect. 2008. PMID: 18335092 Free PMC article.
-
Paradigm shift in toxicity testing and modeling.AAPS J. 2012 Sep;14(3):473-80. doi: 10.1208/s12248-012-9358-1. Epub 2012 Apr 20. AAPS J. 2012. PMID: 22528508 Free PMC article. Review.
-
In vitro screening for population variability in toxicity of pesticide-containing mixtures.Environ Int. 2015 Dec;85:147-55. doi: 10.1016/j.envint.2015.09.012. Epub 2015 Sep 19. Environ Int. 2015. PMID: 26386728 Free PMC article.
-
Safety and nutritional assessment of GM plants and derived food and feed: the role of animal feeding trials.Food Chem Toxicol. 2008 Mar;46 Suppl 1:S2-70. doi: 10.1016/j.fct.2008.02.008. Epub 2008 Feb 13. Food Chem Toxicol. 2008. PMID: 18328408 Review.
Cited by
-
Model systems and organisms for addressing inter- and intra-species variability in risk assessment.Regul Toxicol Pharmacol. 2022 Jul;132:105197. doi: 10.1016/j.yrtph.2022.105197. Epub 2022 May 28. Regul Toxicol Pharmacol. 2022. PMID: 35636685 Free PMC article. Review.
-
FutureTox: building the road for 21st century toxicology and risk assessment practices.Toxicol Sci. 2014 Feb;137(2):269-77. doi: 10.1093/toxsci/kft252. Epub 2013 Nov 7. Toxicol Sci. 2014. PMID: 24204016 Free PMC article.
-
Methods for evaluating variability in human health dose-response characterization.Hum Ecol Risk Assess. 2019 Nov 6;25:1-24. doi: 10.1080/10807039.2019.1615828. Hum Ecol Risk Assess. 2019. PMID: 31404325 Free PMC article.
-
Bridging the Data Gap From in vitro Toxicity Testing to Chemical Safety Assessment Through Computational Modeling.Front Public Health. 2018 Sep 11;6:261. doi: 10.3389/fpubh.2018.00261. eCollection 2018. Front Public Health. 2018. PMID: 30255008 Free PMC article. Review.
-
Initial Assessment of Variability of Responses to Toxicants in Donor-Specific Endothelial Colony Forming Cells.Front Public Health. 2018 Dec 21;6:369. doi: 10.3389/fpubh.2018.00369. eCollection 2018. Front Public Health. 2018. PMID: 30622937 Free PMC article.
References
-
- Andrew FD, Staples RE. Prenatal toxicity of medroxyprogesterone acetate in rabbits, rats, and mice. Teratology. 1977;15:25–32. - PubMed
-
- Aulchenko YS, Ripke S, Isaacs A, van Duijn CM. GenABEL: An R library for genome-wide association analysis. Bioinformatics. 2007;23:1294–1296. - PubMed
-
- Benjamini, Y., and Yekutieli, D. (2001). The control of the false discovery rate in multiple testing under dependency. Ann. Stat. 29, 1165–1188.
