Randomized Controlled Trial
. 2012 Jan 23:13:11.
doi: 10.1186/1745-6215-13-11.

Comparison of embedded and added motor imagery training in patients after stroke: results of a randomised controlled pilot trial

Affiliations
Randomized Controlled Trial

Comparison of embedded and added motor imagery training in patients after stroke: results of a randomised controlled pilot trial

Corina Schuster et al. Trials. .

Abstract

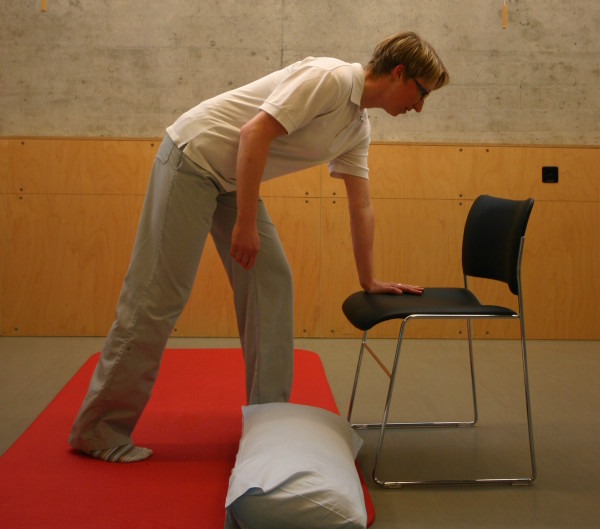
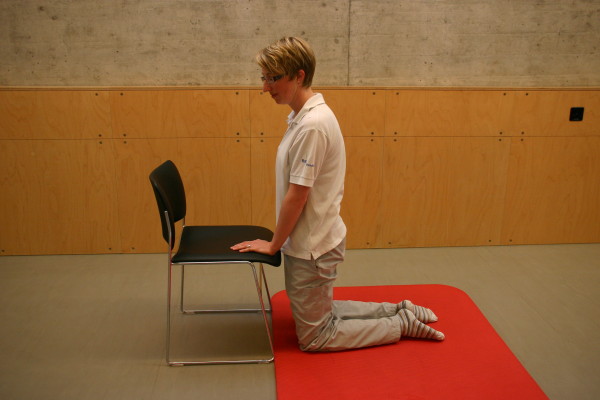
Background: Motor imagery (MI) when combined with physiotherapy can offer functional benefits after stroke. Two MI integration strategies exist: added and embedded MI. Both approaches were compared when learning a complex motor task (MT): 'Going down, laying on the floor, and getting up again'.

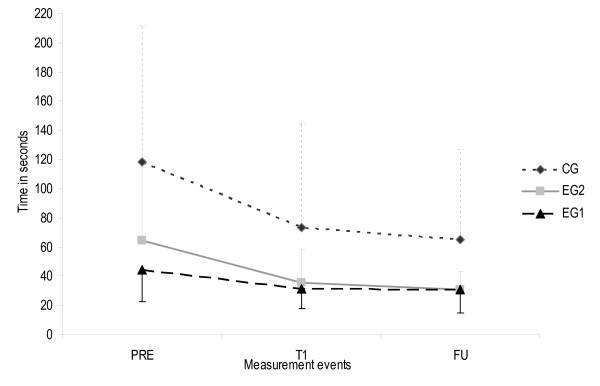
Methods: Outpatients after first stroke participated in a single-blinded, randomised controlled trial with MI embedded into physiotherapy (EG1), MI added to physiotherapy (EG2), and a control group (CG). All groups participated in six physiotherapy sessions. Primary study outcome was time (sec) to perform the motor task at pre and post-intervention.

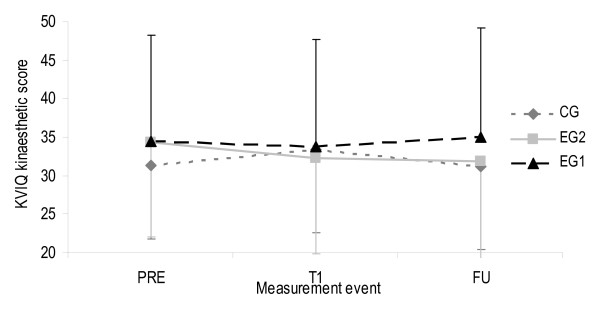
Secondary outcomes: level of help needed, stages of MT-completion, independence, balance, fear of falling (FOF), MI ability. Data were collected four times: twice during one week baseline phase (BL, T0), following the two week intervention (T1), after a two week follow-up (FU). Analysis of variance was performed.

Results: Thirty nine outpatients were included (12 females, age: 63.4 ± 10 years; time since stroke: 3.5 ± 2 years; 29 with an ischemic event). All were able to complete the motor task using the standardised 7-step procedure and reduced FOF at T0, T1, and FU. Times to perform the MT at baseline were 44.2 ± 22s, 64.6 ± 50s, and 118.3 ± 93s for EG1 (N = 13), EG2 (N = 12), and CG (N = 14). All groups showed significant improvement in time to complete the MT (p < 0.001) and degree of help needed to perform the task: minimal assistance to supervision (CG) and independent performance (EG1+2). No between group differences were found. Only EG1 demonstrated changes in MI ability over time with the visual indicator increasing from T0 to T1 and decreasing from T1 to FU. The kinaesthetic indicator increased from T1 to FU. Patients indicated to value the MI training and continued using MI for other difficult-to-perform tasks.

Conclusions: Embedded or added MI training combined with physiotherapy seem to be feasible and benefi-cial to learn the MT with emphasis on getting up independently. Based on their baseline level CG had the highest potential to improve outcomes. A patient study with 35 patients per group could give a conclusive answer of a superior MI integration strategy.

Trial registration: ClinicalTrials.gov: NCT00858910.


Figures

Figure 1
Figure 1
Study overview. BL Baseline measurement event, T0 Pre-intervention measurement event, T1 Post-intervention measurement event, FU Follow-up measurement event, EG1 Ex-perimental group 1, EG2 Experimental group 2, CG Control group.
Figure 2
Figure 2
Motor task stage 0: Standing.
Figure 3
Figure 3
Motor task stage 1: Stride standing.
Figure 4
Figure 4
Motor task stage 2: To half-kneeling.
Figure 5
Figure 5
Motor task stage 3: To high-kneeling.
Figure 6
Figure 6
Motor task stage 4: To half-sitting.
Figure 7
Figure 7
Motor task stage 5: To side laying.
Figure 8
Figure 8
Motor task stage 6: To supine laying.
Figure 9
Figure 9
Patient analysis flow chart. BL Baseline measurement event, T0 Pre-intervention measurement event, T1 Post-intervention measurement event, FU Follow-up measurement event, EG1 Experimental group 1, EG2 Experimental group 2, CG Control group, N Sample size.
Figure 10
Figure 10
Time needed to perform the motor task for all measurement events. Error bars show one standard deviation of the means. The upper limit for CG and EG2, and the lower limit for the EG1 were added to remain easy and fast readability of the figures. EG1 Experimental group 1, EG2 Experimental group 2, CG Control group, PRE Pre-intervention (scores from BL and T0 were calculated with BL+T02=PRE to estimate one pre-intervention score), T1 Post-intervention (after 2 week intervention period), FU Follow-up (2 weeks after intervention finalisation).
Figure 11
Figure 11
Help needed to perform the motor task for all measurement events. Error bars show one standard deviation of the means. The upper limit for CG and the lower limit for EG1 and EG2 were added to remain easy and fast readability of the figures., EG1 Experimental group 1, EG2 Experimental group 2, CG Control group, PRE Pre-intervention (scores from BL and T0 were calculated with BL+T02=PRE to estimate one pre-intervention score), T1 Post-intervention (after 2 week intervention period), FU Follow-up (2 weeks after intervention finalisation).
Figure 12
Figure 12
Visual subscale values of the KVIQ for all measurement events. Error bars show one stan-dard deviation of the means. The upper limit for CG and EG2, and the lower limit for the EG1 were added to remain easy and fast readability of the figures. KVIQ Kinaesthetic and visual imagery questionnaire (scoring range between 20 and 50), EG1 Experimental group 1, EG2 Experimental group 2, CG Control group, PRE Pre-intervention (scores from BL and T0 were calculated with BL+T02=PRE to estimate one pre-intervention score), T1 Post-intervention (after 2 week intervention period), FU Follow-up (2 weeks after intervention finalisation).
Figure 13
Figure 13
Kinaesthetic subscale values of the KVIQ for all measurement events. Error bars show one standard deviation of the means. The upper limit for CG and the lower limit for EG1 and EG2 were added to remain easy and fast readability of the figures. KVIQ Kinaesthetic and visual imagery questionnaire (scoring range between 20 and 50). EG1 Experimental group 1, EG2 Experimental group 2, CG Control group, PRE Pre-intervention (scores from BL and T0 were calculated with BL+T02=PRE to estimate one pre-intervention score), T1 Post-intervention (after 2 week intervention period), FU Follow-up (2 weeks after intervention finalisation).

References

    1. Decety J. The neurophysiological basis of motor imagery. Behav Brain Res. 1996;77(1-2):45–52. doi: 10.1016/0166-4328(95)00225-1. - DOI - PubMed
    1. Jeannerod M, Frak V. Mental imaging of motor activity in humans. Curr Opin Neurobiol. 1999;9(6):735–739. doi: 10.1016/S0959-4388(99)00038-0. - DOI - PubMed
    1. Page SJ. Imagery improves upper extremity motor function in chronic stroke patients: a pilot study. Occup Ther J Res. 2000;20(3):200–215.
    1. Page SJ, Levine P, Sisto S, Johnston MV. A randomized efficacy and feasibility study of imagery in acute stroke. Clin Rehabil. 2001;15(3):233–240. doi: 10.1191/026921501672063235. - DOI - PubMed
    1. Page SJ, Levine P, Sisto SA, Johnston MV. Mental practice combined with physical practice for upper-limb motor deficit in subacute stroke. Phys Ther. 2001;81(8):1455–1462. - PubMed

Publication types

MeSH terms

Associated data