. 2012 Mar;32(6):1099-111.
doi: 10.1128/MCB.06465-11. Epub 2012 Jan 23.

Berardinelli-seip congenital lipodystrophy 2/seipin is a cell-autonomous regulator of lipolysis essential for adipocyte differentiation

Berardinelli-seip congenital lipodystrophy 2/seipin is a cell-autonomous regulator of lipolysis essential for adipocyte differentiation

Weiqin Chen et al. Mol Cell Biol. 2012 Mar.

Abstract

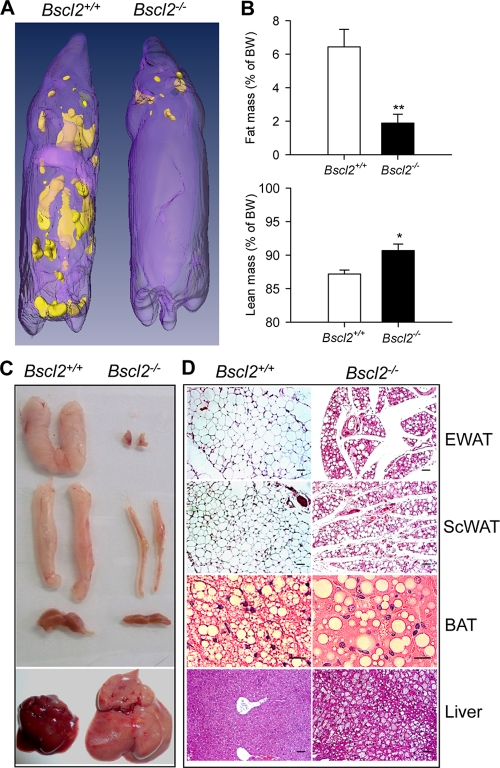
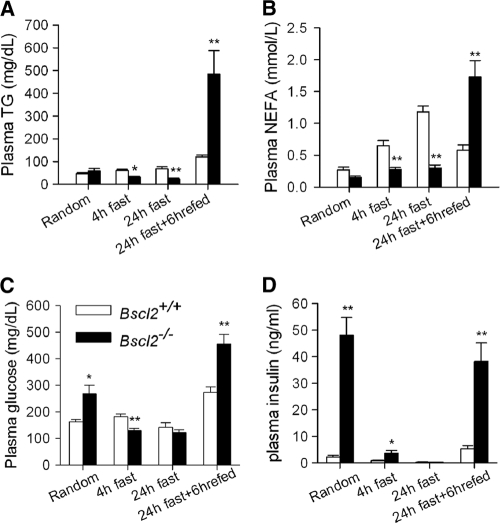
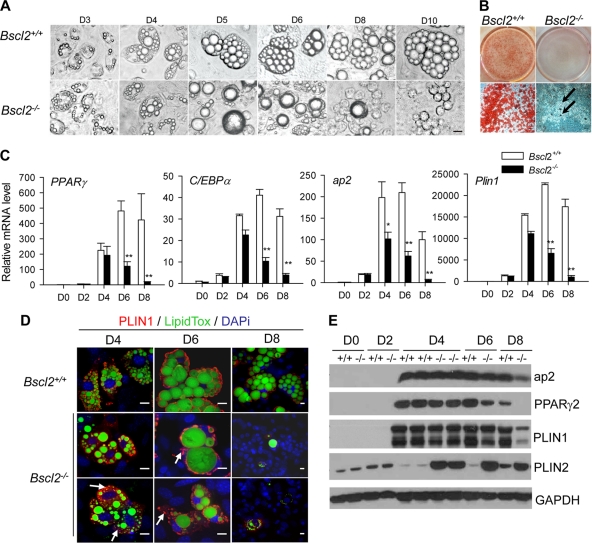
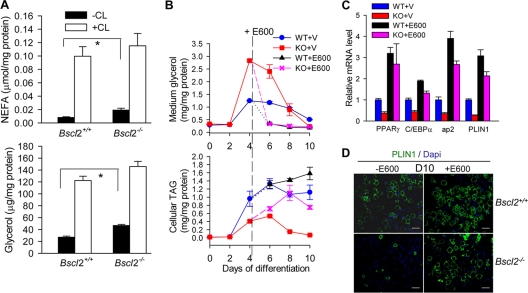
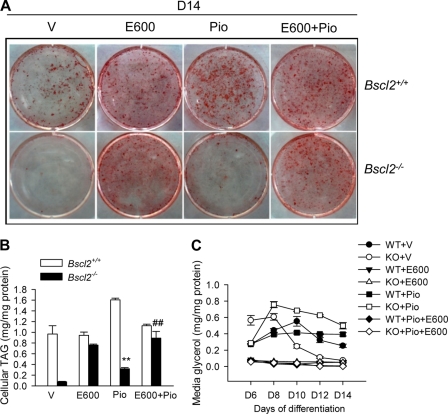
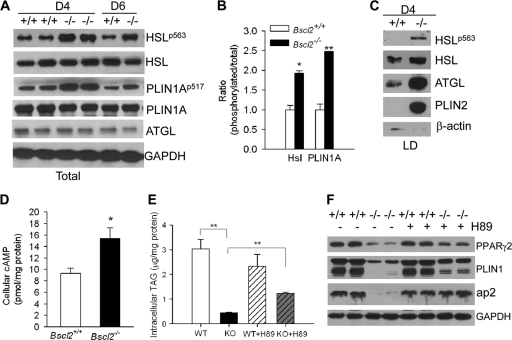
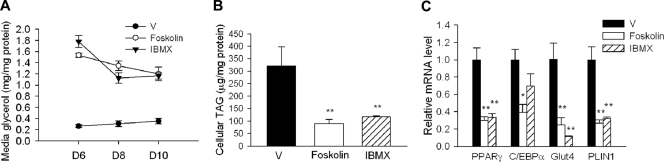
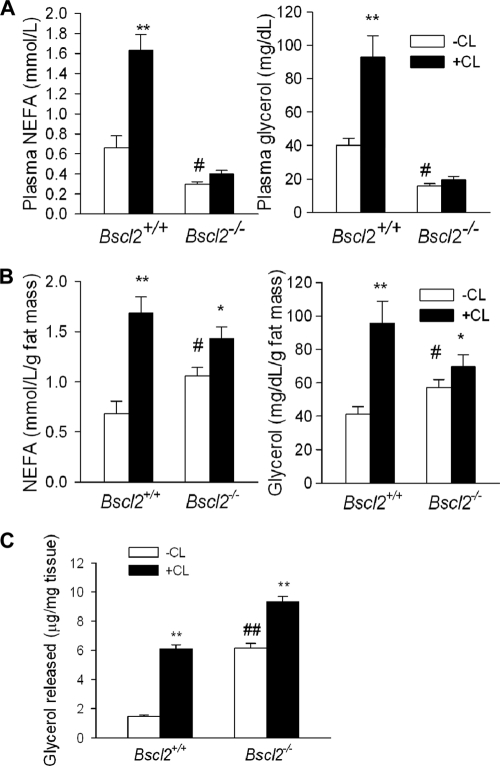
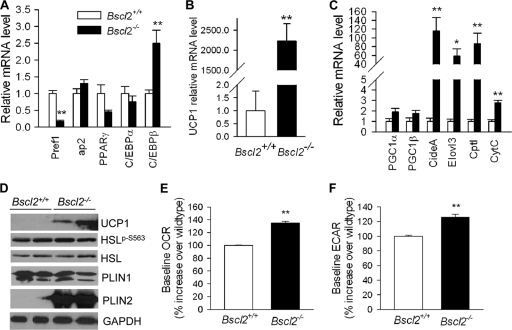
Mutations in BSCL2 underlie human congenital generalized lipodystrophy. We inactivated Bscl2 in mice to examine the mechanisms whereby absence of Bscl2 leads to adipose tissue loss and metabolic disorders. Bscl2(-/-) mice develop severe lipodystrophy of white adipose tissue (WAT), dyslipidemia, insulin resistance, and hepatic steatosis. In vitro differentiation of both Bscl2(-/-) murine embryonic fibroblasts (MEFs) and stromal vascular cells (SVCs) reveals normal early-phase adipocyte differentiation but a striking failure in terminal differentiation due to unbridled cyclic AMP (cAMP)-dependent protein kinase A (PKA)-activated lipolysis, which leads to loss of lipid droplets and silencing of the expression of adipose tissue-specific transcription factors. Importantly, such defects in differentiation can be largely rescued by inhibitors of lipolysis but not by a gamma peroxisome proliferator-activated receptor (PPARγ) agonist. The residual epididymal WAT (EWAT) in Bscl2(-/-) mice displays enhanced lipolysis. It also assumes a "brown-like" phenotype with marked upregulation of UCP1 and other brown adipose tissue-specific markers. Together with decreased Pref1 but increased C/EBPβ levels, these changes highlight a possible increase in cAMP signaling that impairs terminal adipocyte differentiation in the EWAT of Bscl2(-/-) mice. Our study underscores the fundamental role of regulated cAMP/PKA-mediated lipolysis in adipose differentiation and identifies Bscl2 as a novel cell-autonomous determinant of activated lipolysis essential for terminal adipocyte differentiation.


Figures

Fig 1
Fig 1
Bscl2−/− mice develop congenital generalized lipodystrophy. (A) 3D reconstruction of magnetic resonance imaging of the 12-week-old male wild-type and Bscl2−/− mice, with yellow color indicating fat. (B) EchoMRI analysis indicated the total fat mass and lean mass in 8-week-old male wild-type and Bscl2−/− mice (n = 8). Data were normalized to body weight (BW). *, P < 0.05; **, P < 0.005. (C and D) Gross appearances (C) and histology (D) of epididymal white fat pad (EWAT), subcutaneous white fat pad (ScWAT), interscapular brown fat pad (BAT), and liver of 12-week-old wild-type and Bscl2−/− mice. Sections of paraffin-fixed tissues were stained with hematoxylin-eosin and examined by light microscopy. Scale bar, 20 μm.
Fig 2
Fig 2
Bscl2−/− mice have altered lipid and carbohydrate homeostasis. Plasma triacylglycerol (TAG) (A), nonesterified fatty acids (NEFA) (B), glucose(C), and insulin (D) were measured in 10-week-old male wild-type and Bscl2−/− mice at a randomly selected time (10 a.m.) or after a 4-h fast, 24-h fast, and 24-h fast followed by refeeding (6 h) with normal chow diet (n = 8 to 10 each). *, P < 0.05; **, P < 0.005 (for comparisons of Bscl2+/+ and Bscl2−/− mice under same conditions).
Fig 3
Fig 3
Bscl2 is essential in lipid droplet and mature adipocyte maintenance in vitro. (A) Comparison of lipid droplet formation and changes during different days (day 3 [D3] to D10) of differentiation in wild-type and Bscl2−/− MEFs using a light microscope. Scale bar, 10 μm (all images). (B) Oil-Red O staining of day 8 wild-type and Bscl2−/− MEF adipocytes. Scale bar, 10 μm. Arrows indicate the very few Oil-Red O-stained differentiated cells in Bscl2−/− MEFs at day 8. (C) Quantitative RT-PCR analyses of master adipocyte differentiation transcription factors (PPARγ and C/EBPα) as well as mature adipocyte markers (ap2 and Plin1) in wild-type and Bscl2−/− MEFs undergoing differentiation. Data were normalized to cyclophilin A and are expressed as relative fold changes compared to the wild type at day 0 (the day when the differentiation medium was added). *, P < 0.05; **, P < 0.005 (versus wild-type on the same day). (D) Immunofluorescent staining of PLIN1 and LipidTOX (a specific neutral lipid dye) in MEFs at day 4, day 6, and day 8 after differentiation. Arrows indicate microlipid droplets that were mainly stained by PLIN1 in Bscl2−/− MEF cells. Scale bar, 10 μm. (E) Western blot analysis of whole-cell lysates harvested from wild-type and Bscl2−/− MEFs at different days of differentiation. Identical amounts of proteins were loaded, and GAPDH was used as a loading control.
Fig 4
Fig 4
Enhanced lipolysis leads to aborted adipocyte differentiation in Bscl2−/− MEFs which could be restored by lipase inhibitors. (A) NFFA and glycerol release in day 4 differentiating wild-type and Bscl2−/− MEFs under conditions of basal and CL 316243-stimulated lipolysis in vitro. Data were normalized to cellular protein levels. *, P < 0.05; **, P < 0.005. (B) Medium glycerol as well as intracellular TAG levels were assessed at the indicated days of differentiation in the wild-type (WT) and Bscl2−/− (KO) MEFs. Data were normalized to cellular protein levels. Vehicle (V) or 200 μM E600, a lipase inhibitor, was added at day 4 and afterward. (C) Quantitative RT-PCR analyses of mRNA expression of PPARγ, C/EBPα, ap2, and Plin1 in day 10 wild-type (WT) and Bscl2−/− (KO) MEFs with vehicle (V) or E600 treatment. Data were normalized to cyclophilin A and are expressed as relative fold changes compared to the wild type treated with vehicle. (D) Immunofluorescence staining with anti-PLIN1 antibody on day 10 of Bscl2+/+ and Bscl2−/− MEFs with (+) or without (−) E600 treatment. Scale bar, 50 μm.
Fig 5
Fig 5
A PPARγ agonist could not significantly rescue the adipocyte differentiation defect in Bscl2−/− MEFs. (A) Oil-Red O staining of day 14 wild-type and Bscl2−/− MEFs with E600 (from day 4) and/or pioglitazone (from day 0) treatment. (B and C) Intracellular TAG levels at day 14 (B) and medium glycerol (from day 6 to day 14) (C) were assessed at the indicated days of differentiation in the wild-type (WT) and Bscl2−/− (KO) MEFs. Data were normalized to cellular protein levels. Piglitazone (Pio) (1 μM) was included throughout the differentiation, while vehicle (V) or 200 μM E600 was added from day 4 and afterward. **, P < 0.005 (versus WT with Pio); ##, P < 0.05 (versus KO with Pio treatment alone).
Fig 6
Fig 6
Increased cAMP-dependent PKA-stimulated lipolysis impairs adipocyte differentiation. (A) Western blot analyses of lipolytic proteins in day 4 and day 6 wild-type (+/+) and Bscl2−/− (−/−) MEF whole-cell lysates. Antibodies against phospho-specific proteins as well as total proteins were used as indicated. (B) Semiquantitative analysis of ratio of phosphorylated to total HSL and PLIN1A in the day 4 differentiating wild-type and Bscl2−/− MEFs. (C) Western blot analyses of lipolytic proteins in isolated intracellular LDs from day 4 differentiating wild-type (+/+) and Bscl2−/− (−/−) MEFs, with β-actin as a loading control. (D) Intracellular cAMP levels in day 4 differentiating wild-type and Bscl2−/− MEF cells. Data were normalized to total cytosolic proteins. (E) The intracellular TAG levels in day 12 wild-type (WT) and Bscl2−/− (KO) MEF cells with vehicle (+V) or H89 (+H89) treatment. H89 (10 μM) was added at day 4. Data were normalized to total cellular proteins. (F) Western blot analyses of mature adipocyte markers in day 12 differentiated wild-type (+/+) and Bscl2−/− (−/−) MEFs with (+) or without (−) H89 treatment. Identical amounts of proteins were loaded, and GAPDH was used as a loading control.
Fig 7
Fig 7
Chronic activation of cAMP/PKA signaling impairs wild-type MEF differentiation. (A) The medium glycerol levels in day 6 to day 10 wild-type MEF cells chronically treated with vehicle dimethyl sulfoxide (DMSOJ) (V), forskolin (10 μM), or IBMX (0.5 mM) from day 4. Data were normalized to total cellular proteins. **, P < 0.005. (B and C) The intracellular TAG levels (B) and mRNA expression (C) in day 10 wild-type (WT) MEF cells with chronic vehicle (V), forskolin (10 μM), or IBMX (0.5 mM) treatment from day 4. *, P < 0.05. **, P < 0.005.
Fig 8
Fig 8
The EWAT of Bscl2−/− mice has higher lipolysis in vivo and ex vivo. (A and B) NFFA and glycerol release in 12-week-old male wild-type and Bscl2−/− mice (n = 6 each) under conditions of basal and CL 316243-stimulated lipolysis in vivo without normalization (A) and with normalization to total fat mass contents based on EchoMRI (B). (C) Ex vivo lipolysis of EWAT explants from wild-type and Bscl2−/− mice. EWAT fat explants were taken from 6-week-old male wild-type and Bscl2−/− mice. After intensive washing, lipolysis was performed with or without CL 316243 (+CL) for 2 h. The amounts of glycerol released were normalized to the explant wet weights. n = 6 each. *, P < 0.05; **, P < 0.005 [versus basal state (-CL) among the same genotype]; ##, P < 0.005 [versus wild-type mice at basal state (-CL)].
Fig 9
Fig 9
Gene and protein expression in EWAT of wild-type and Bscl2−/− mice in vivo. (A to C) qPCR analyses of genes involved in adipocyte differentiation (A), UCP1 (B), and brown adipose tissue-specific marker genes (C) in EWAT of 13-week-old nonfasting male wild-type and Bscl2−/− mice (n = 6). Data were normalized to 3 housekeeping genes (cyclophilin A, Eelf1γ and β-actin genes) based on the Genorm algorithm (http://medgen.ugent.be/genorm/) and are expressed as fold changes relative to wild-type controls. (D) Western blot analyses of lysates extracted from EWAT of 6-week-old male wild-type and Bscl2−/− mice. Identical amounts of protein were loaded. GAPDH was used as a loading control. (E and F) Baseline OCR (E) and ECAR (F) in day 4 differentiating Bscl2+/+ and Bscl2−/− MEFs. The basal rates shown represent averages of 10 time points each with 4 wells and are presented as percent increases over wild-type baseline values. *, P < 0.05; **, P < 0.005 (between the two genotypes).

References

    1. Agarwal AK, Barnes RI, Garg A. 2004. Genetic basis of congenital generalized lipodystrophy. Int. J. Obes. Relat. Metab. Disord. 28:336–339 - PubMed
    1. Agarwal AK, Garg A. 2003. Congenital generalized lipodystrophy: significance of triglyceride biosynthetic pathways. Trends Endocrinol. Metab. 14:214–221 - PubMed
    1. Agarwal AK, et al. 2003. Phenotypic and genetic heterogeneity in congenital generalized lipodystrophy. J. Clin. Endocrinol. Metab. 88:4840–4847 - PubMed
    1. Berardinelli W. 1954. An undiagnosed endocrinometabolic syndrome: report of 2 cases. J. Clin. Endocrinol. Metab. 14:193–204 - PubMed
    1. Bligh EG, Dyer WJ. 1959. A rapid method of total lipid extraction and purification. Can. J. Biochem. Physiol. 37:911–917 - PubMed

Publication types

MeSH terms