. 2012 Mar;22(3):490-503.
doi: 10.1038/cr.2012.15. Epub 2012 Jan 24.

Characterization of genome-wide enhancer-promoter interactions reveals co-expression of interacting genes and modes of higher order chromatin organization

Affiliations

Characterization of genome-wide enhancer-promoter interactions reveals co-expression of interacting genes and modes of higher order chromatin organization

Iouri Chepelev et al. Cell Res. 2012 Mar.

Abstract

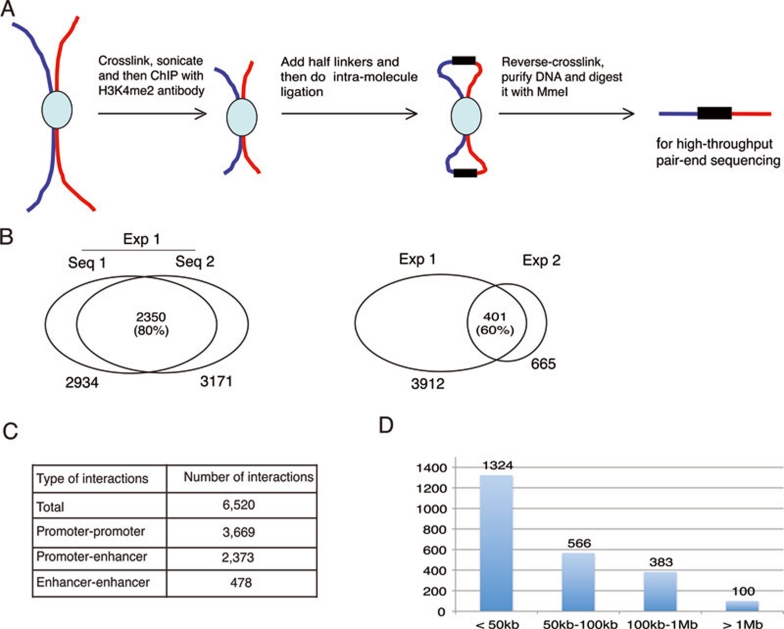
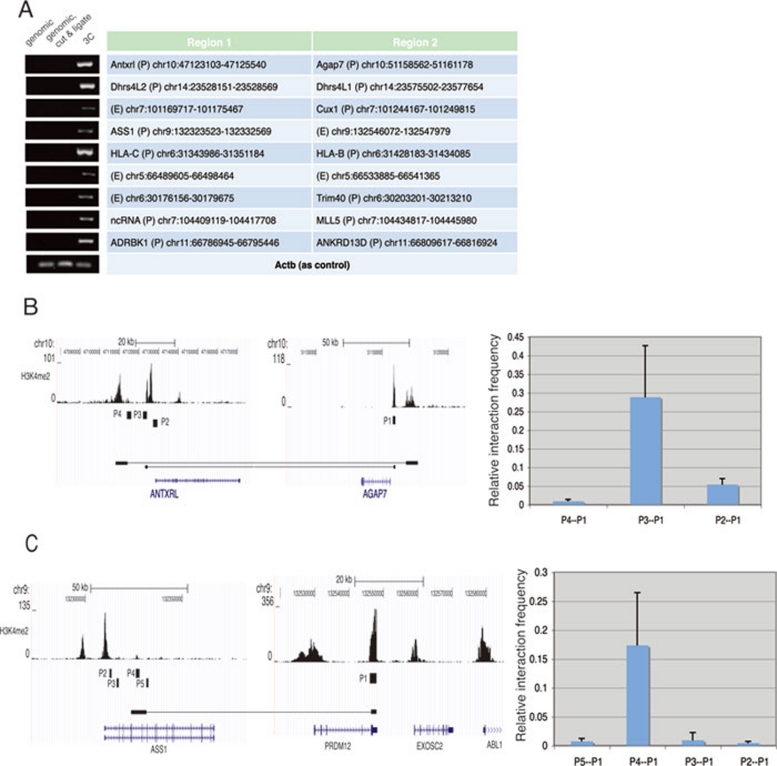
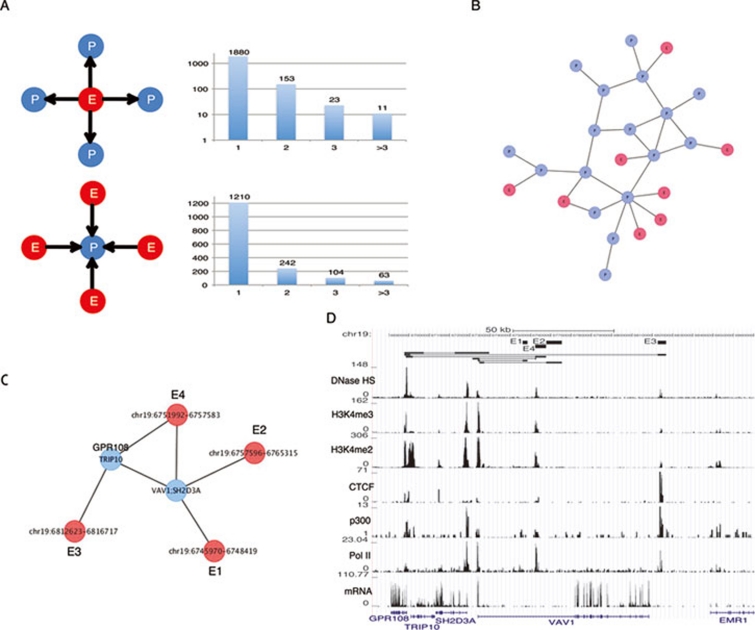
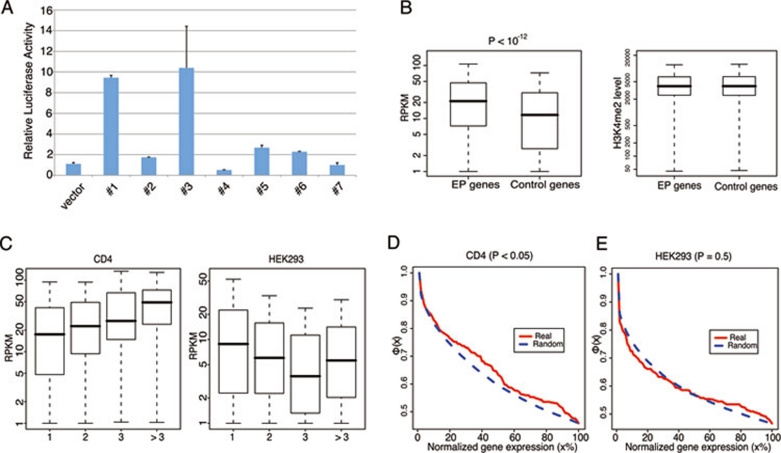
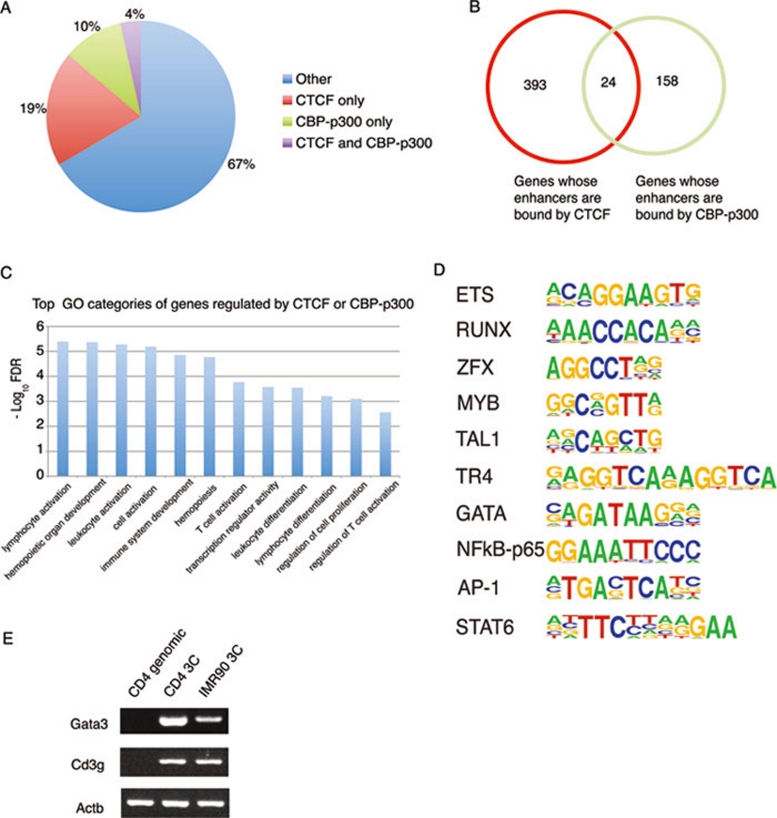
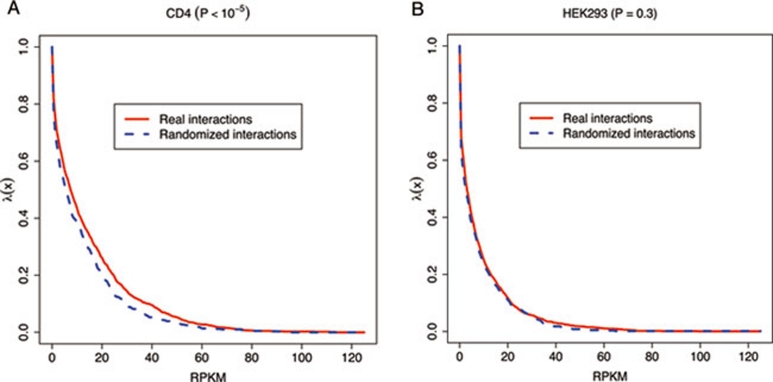
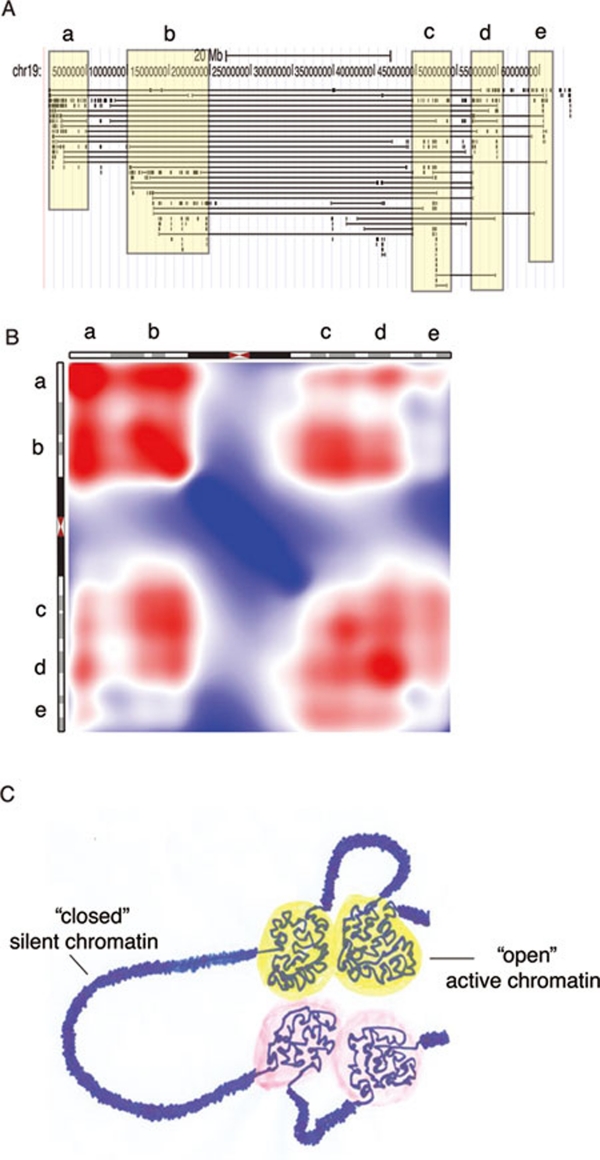
Recent epigenomic studies have predicted thousands of potential enhancers in the human genome. However, there has not been systematic characterization of target promoters for these potential enhancers. Using H3K4me2 as a mark for active enhancers, we identified genome-wide EP interactions in human CD4(+) T cells. Among the 6 520 long-distance chromatin interactions, we identify 2 067 enhancers that interact with 1 619 promoters and enhance their expression. These enhancers exist in accessible chromatin regions and are associated with various histone modifications and polymerase II binding. The promoters with interacting enhancers are expressed at higher levels than those without interacting enhancers, and their expression levels are positively correlated with the number of interacting enhancers. Interestingly, interacting promoters are co-expressed in a tissue-specific manner. We also find that chromosomes are organized into multiple levels of interacting domains. Our results define a global view of EP interactions and provide a data set to further understand mechanisms of enhancer targeting and long-range chromatin organization. The Gene Expression Omnibus accession number for the raw and analyzed chromatin interaction data is GSE32677.


Figures

Figure 1
Figure 1
Identification of genome-wide enhancer-promoter interactions. (A) Experimental scheme. Chromatin fractions prepared from formaldehyde-crosslinked human primary resting CD4+ T cells by sonication were immunoprecipitated using H3K4me2 antibodies. The ChIP DNA was processed following the ChIA-PET protocol. The library was sequenced by paired-end sequencing on HiSeq 2000. (B) Technical and biological replicates indicate significant overlap of detected interactions. (C) Summary of types of interactions. (D) Distance of enhancers to their target promoters. Each column shows the number of enhancer-promoter interactions at a certain distance between the enhancer and target promoter.
Figure 2
Figure 2
Validation of the genome-wide interaction data. (A) 3C-PCR validation of randomly selected interactions. T cells were crosslinked using formaldehyde, digested with EcoRI and re-ligated following 3C protocols. The purified DNA was analyzed using specific primers for the genomic regions as indicated. β-actin promoter was used as an input control. (B) The specific interaction between the ANTXRL and AGAP7 genes were confirmed by 3C-quantitative PCR assays. The left panel shows the two genomic regions that interact, indicated by two filled boxes linked by a line. The H3K4me2 peaks are shown. P1 to P4 indicate the specific PCR primers designed to test the 3C interactions. The right panel shows the quantitative PCR signals of re-ligation products surrounding EcoRI sites using different combination of PCR primers, as indicated below the panel. (C) The specific interaction between the ASS1 and PRDM12 genes were confirmed as described in panel B.
Figure 3
Figure 3
Identification of enhancer-promoter interaction networks. (A) Different modes of enhancer-promoter interactions as illustrated on the left. The upper panel indicates the number of promoters (under the columns) that interact with each enhancer; the lower panel indicates the number of enhancers (under the column) that interact with one promoter. The numbers on Y axes correspond to the numbers of enhancers (upper panel) and promoters (lower panel) in each category. (B) One cluster of enhancer-promoter interactions on chromosome 19 was shown. Red: enhancers; blue: promoters. (C) The interaction network at the VAV1 locus. (D) The interaction network, gene expression and other features at the VAV1 locus.
Figure 4
Figure 4
Increased expression is associated with the detected enhancer-promoter interactions. (A) The identified enhancers activate transcription from a heat shock reporter promoter. The potential enhancer was cloned upstream of the basal heat shock promoter driving a luciferase reporter gene and tested in Jurkat T cells. (B) Significantly higher expression is detected for the genes with enhancer-promoter interactions. Box plots of the RPKM values of the genes showing EP interactions (EP genes) and the controls genes that do not have interacting enhancers but have similar levels of H3K4me2 in promoter regions (left panel). The right panel shows the similar levels of H3K4me2 at the enhancer target genes (EP genes) and the control genes. (C) Box plots showing that the expression of a gene is positively correlated with the number of enhancers that interact with its promoter. The expression of genes interacting with different numbers of enhancers (indicated below the panel) is shown for CD4+ T cells (left panel) and HEK293 cells (right panel). (D) Genes interacting with the same enhancer are co-expressed in CD4+ T cells (red: genes linked by the same enhancer; blue: randomized gene list). Y axis indicates the average higher order correlation characteristic of genes linked by a shared enhancer (see Materials and methods for detail) and X axis indicates the normalized expression level. (E) The same analysis as in Figure 4D but using gene expression data in HEK293 cells.
Figure 5
Figure 5
CTCF-bound and p300-bound enhancers jointly control T cell-specific gene expression. (A) Pie diagram showing the fractions of enhancers bound by CTCF or p300 and/or CBP. (B) Venn diagram showing the number of genes interacting with CTCF-bound enhancers, p300-bound enhancers, and both classes of enhancers. (C) The genes interacting with either the CTCF-bound enhancers or p300-bound enhancers are highly enriched in T cell and immune functions as indicated by Gene Ontology analysis. (D) Highly enriched motifs identified in the 2 067 enhancers. (E) Stronger enhancer-promoter interaction was detected at T cell-specific genes. Human CD4+ T cells and IMR90 cells were crosslinked with formaldehyde, digested with EcoRI and the DNA ends were re-ligated. The products derived from long-range chromatin interaction were analyzed by PCR using specific primers.
Figure 6
Figure 6
The expression of interacting promoters is correlated. (A) Intra-chromosomal interacting promoters are co-expressed. The pairwise gene expression correlation characteristic (Y axis) versus the gene expression level (X axis) measured by RKPM values in human primary CD4+ T cells is plotted (see Materials and methods). (B) Same as in (A) except that the gene expression was measured in HEK293 cells.
Figure 7
Figure 7
Multiple levels of chromatin organization mediated by long-distance chromatin interactions. (A) All interactions between regions > 20 kb distant for chromosome 19 are plotted. The five regions that show dense “local” interactions are highlighted and labeled as domains a-e. (B) The global chromatin interaction heatmap for chromosome 19 is shown. Red color indicates dense interaction and blue color indicates sparse interaction. The five domains (a-e) showing dense interaction are indicated on the chromosome. (C) Cartoon showing the multiple levels of chromatin organization mediated by long-distance chromatin interactions beyond the 30 nm fiber.

Similar articles

Cited by

References

    1. Roh TY, Wei G, Farrell CM, Zhao K. Genome-wide prediction of conserved and nonconserved enhancers by histone acetylation patterns. Genome Res. 2007;17:74–81. - PMC - PubMed
    1. Creyghton MP, Cheng AW, Welstead GG, et al. Histone H3K27ac separates active from poised enhancers and predicts developmental state. Proc Natl Acad Sci USA. 2011;107:21931–21936. - PMC - PubMed
    1. Rada-Iglesias A, Bajpai R, Swigut T, Brugmann SA, Flynn RA, Wysocka J. A unique chromatin signature uncovers early developmental enhancers in humans. Nature. 2011;470:279–283. - PMC - PubMed
    1. Visel A, Blow MJ, Li Z, et al. ChIP-seq accurately predicts tissue-specific activity of enhancers. Nature. 2009;457:854–858. - PMC - PubMed
    1. Wang Z, Zang C, Cui K, et al. Genome-wide mapping of HATs and HDACs reveals distinct functions in active and inactive genes. Cell. 2009;138:1019–1031. - PMC - PubMed

Publication types

MeSH terms

Substances

Associated data