. 2012 Mar;14(3):333-43.
doi: 10.1093/neuonc/nor220. Epub 2012 Jan 22.

Functional diffusion maps (fDMs) evaluated before and after radiochemotherapy predict progression-free and overall survival in newly diagnosed glioblastoma

Affiliations

Functional diffusion maps (fDMs) evaluated before and after radiochemotherapy predict progression-free and overall survival in newly diagnosed glioblastoma

Benjamin M Ellingson et al. Neuro Oncol. 2012 Mar.

Abstract

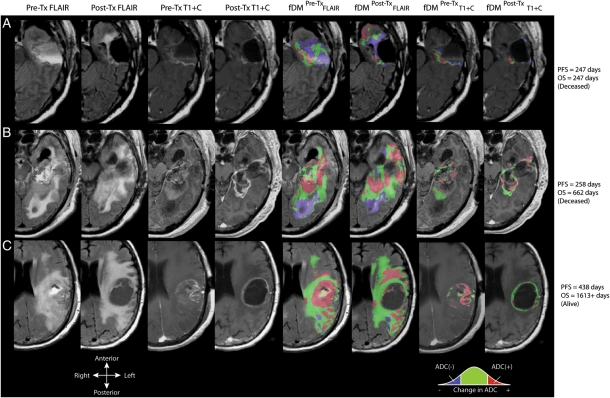
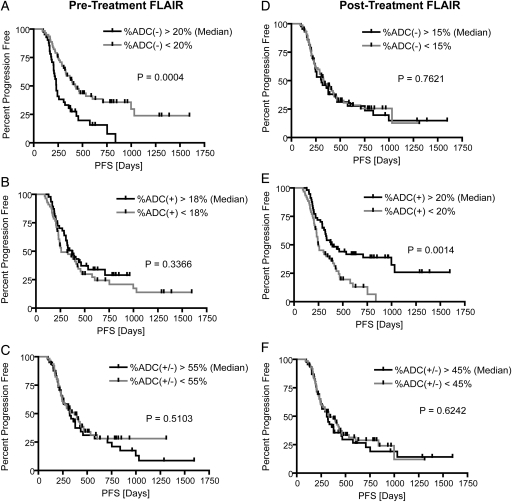
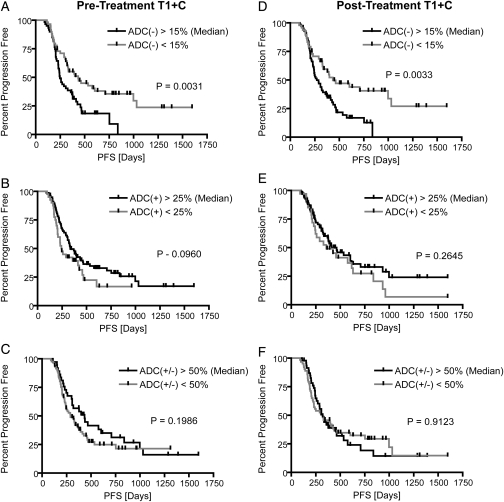
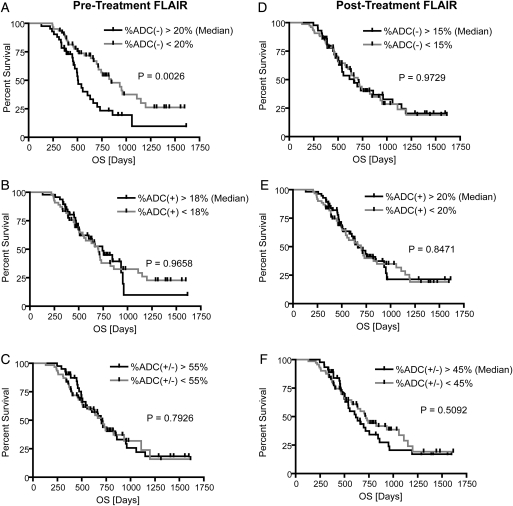
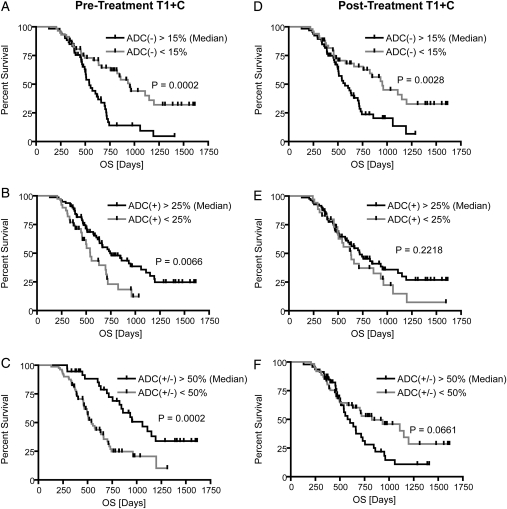
Functional diffusion mapping (fDM) has shown promise as a sensitive imaging biomarker for predicting survival in initial studies consisting of a small number of patients, mixed tumor grades, and before routine use of anti-angiogenic therapy. The current study tested whether fDM performed before and after radiochemotherapy could predict progression-free and overall survival in 143 patients with newly diagnosed glioblastoma from 2007 through 2010, many treated with anti-angiogenic therapy after recurrence. Diffusion and conventional MRI scans were obtained before and 4 weeks after completion of radiotherapy and concurrent temozolomide treatment. FDM was created by coregistering pre- and posttreatment apparent diffusion coefficient (ADC) maps and then performing voxel-wise subtraction. FDMs were categorized according to the degree of change in ADC in pre- and posttreatment fluid-attenuated inversion recovery (FLAIR) and contrast-enhancing regions. The volume fraction of fDM-classified increasing ADC(+), decreasing ADC(-), and change in ADC(+/-) were tested to determine whether they were predictive of survival. Both Bonferroni-corrected univariate log-rank analysis and Cox proportional hazards modeling demonstrated that patients with decreasing ADC in a large volume fraction of pretreatment FLAIR or contrast-enhancing regions were statistically more likely to progress earlier and expire sooner than in patients with a lower volume fraction. The current study supports the hypothesis that fDM is a sensitive imaging biomarker for predicting survival in glioblastoma.


Figures

Fig. 1.
Fig. 1.
Anatomical MRIs and functional diffusion maps (fDMs) for 3 patients with glioblastoma. From left column to right column: pretreatment fluid-attenuated inversion recovery (FLAIR); posttreatment FLAIR; pretreatment, postcontrast T1-weighted images (T1 + C); posttreatment T1 + C; fDMs in pretreatment FLAIR regions of interest (ROIs); fDMs in posttreatment FLAIR ROIs; fDMs in pretreatment T1 + C ROIs; and posttreatment T1 + C ROIs. (A) Patient with a short progression-free survival (PFS) and overall survival (OS), demonstrating a large volume fraction of voxels with decreased ADC (blue) relative to pretreatment ADC maps. (B) Patient with a short PFS but relatively longer OS demonstrates a mixed response of both voxels with a significant increase in ADC (red) and decrease in ADC (blue). (C) Long-term survival patient demonstrating a large volume fraction of tissue with increased ADC (red) and a small volume fraction of tissue with decreased ADC (blue).
Fig. 2.
Fig. 2.
Kaplan-Meier curves for progression-free survival (PFS) using functional diffusion map (fDM) metrics in FLAIR regions of interest (ROIs). (A) Relative volume fraction of tissue within pretreatment FLAIR ROIs exhibiting a significant decrease in ADC [ADC(−)]. (B) Relative volume fraction of tissue within pretreatment FLAIR ROIs exhibiting a significant increase in ADC [ADC(+)]. (C) Relative volume fraction of tissue within pretreatment FLAIR ROIs exhibiting any significant change in ADC [ADC(+/−)]. (D) Relative volume fraction of tissue within posttreatment FLAIR ROIs exhibiting a significant decrease in ADC [ADC(−)]. (E) Relative volume fraction of tissue within posttreatment FLAIR ROIs exhibiting a significant increase in ADC [ADC(+)]. (F) Relative volume fraction of tissue within posttreatment FLAIR ROIs exhibiting any significant change in ADC [ADC(+/−)].
Fig. 3.
Fig. 3.
Kaplan-Meier curves for progression-free survival (PFS) using functional diffusion map (fDM) metrics within T1 + C regions of interest (ROIs). (A) Relative volume fraction of tissue within pretreatment T1 + C ROIs exhibiting a significant decrease in ADC [ADC(−)]. (B) Relative volume fraction of tissue within pretreatment T1 + C ROIs exhibiting a significant increase in ADC [ADC(+)]. (C) Relative volume fraction of tissue within pretreatment T1 + C ROIs exhibiting any significant change in ADC [ADC(+/−)]. (D) Relative volume fraction of tissue within posttreatment T1 + C ROIs exhibiting a significant decrease in ADC [ADC(−)]. (E) Relative volume fraction of tissue within posttreatment T1 + C ROIs exhibiting a significant increase in ADC [ADC(+)]. (F) Relative volume fraction of tissue within posttreatment T1 + C ROIs exhibiting any significant change in ADC [ADC(+/−)].
Fig. 4.
Fig. 4.
Kaplan-Meier curves for overall survival (OS) using functional diffusion map (fDM) metrics within FLAIR regions of interest (ROIs). (A) Relative volume fraction of tissue within pretreatment FLAIR ROIs exhibiting a significant decrease in ADC [ADC(−)]. (B) Relative volume fraction of tissue within pretreatment FLAIR ROIs exhibiting a significant increase in ADC [ADC(+)]. (C) Relative volume fraction of tissue within pretreatment FLAIR ROIs exhibiting any significant change in ADC [ADC(+/−)]. (D) Relative volume fraction of tissue within posttreatment FLAIR ROIs exhibiting a significant decrease in ADC [ADC(−)]. (E) Relative volume fraction of tissue within posttreatment FLAIR ROIs exhibiting a significant increase in ADC [ADC(+)]. (F) Relative volume fraction of tissue within posttreatment FLAIR ROIs exhibiting any significant change in ADC [ADC(+/−)].
Fig. 5.
Fig. 5.
Kaplan-Meier curves for overall survival (OS) using functional diffusion map (fDM) metrics within T1 + C regions of interest (ROIs). (A) Relative volume fraction of tissue within pretreatment T1 + C ROIs exhibiting a significant decrease in ADC [ADC(−)]. (B) Relative volume fraction of tissue within pretreatment T1 + C ROIs exhibiting a significant increase in ADC [ADC(+)]. (C) Relative volume fraction of tissue within pretreatment T1 + C ROIs exhibiting any significant change in ADC [ADC(+/−)]. (D) Relative volume fraction of tissue within posttreatment T1 + C ROIs exhibiting a significant decrease in ADC [ADC(−)]. (E) Relative volume fraction of tissue within posttreatment T1 + C ROIs exhibiting a significant increase in ADC [ADC(+)]. (F) Relative volume fraction of tissue within posttreatment T1 + C ROIs exhibiting any significant change in ADC [ADC(+/−)].

References

    1. CBTRUS. Primary Brain Tumors in the United States 2000–2004. Chicago, IL: Central Brain Tumor Registry of the United States; 2008.
    1. Stupp R, Mason WP, van den Bent MJ, et al. Radiotherapy plus concomitant and adjuvent temozolomide for glioblastoma. N Engl J Med. 2005;352(10):987–996. doi:10.1056/NEJMoa043330. - DOI - PubMed
    1. Provenzale JM, Mukundan S, Barboriak DP. Diffusion-weighted and perfusion MR imaging for brain tumor characterization and assessment of treatment response. Radiology. 2006;239(3):632–649. doi:10.1148/radiol.2393042031. - DOI - PubMed
    1. Sugahara T, Korogi Y, Kochi M, et al. Usefulness of diffusion-weighted MRI with echo-planar technique in the evaluation of cellularity in gliomas. J Magn Reson Imaging. 1999;9:53–60. doi:10.1002/(SICI)1522-2586(199901)9:1<53::AID-JMRI7>3.0.CO;2-2. - DOI - PubMed
    1. Lyng H, Haraldseth O, Rofstad EK. Measurements of cell density and necrotic fraction in human melanoma xenografts by diffusion weighted magnetic resonance imaging. Magn Reson Med. 2000;43(6):828–836. doi:10.1002/1522-2594(200006)43:6<828::AID-MRM8>3.0.CO;2-P. - DOI - PubMed

Publication types