

Purines as potential morphogens during embryonic development
- PMID: 22270538
- PMCID: PMC3360092
- DOI: 10.1007/s11302-012-9290-y
Purines as potential morphogens during embryonic development
Abstract
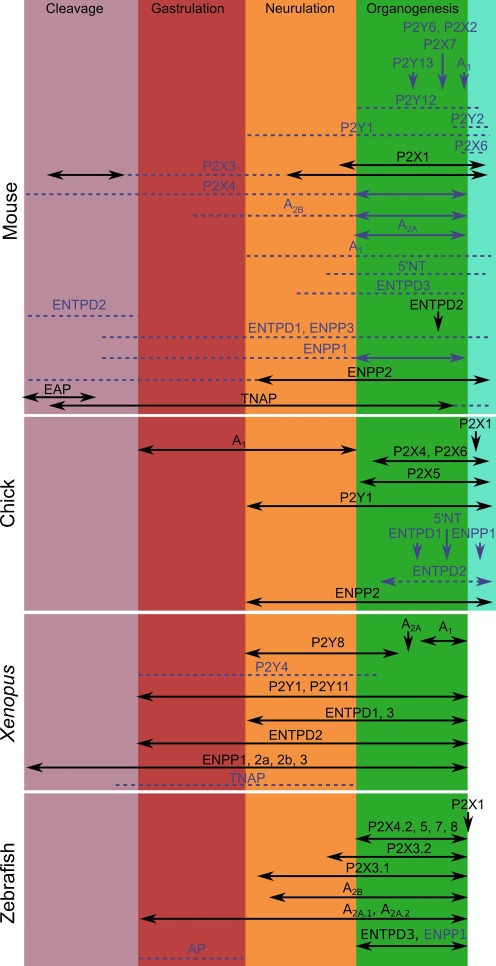
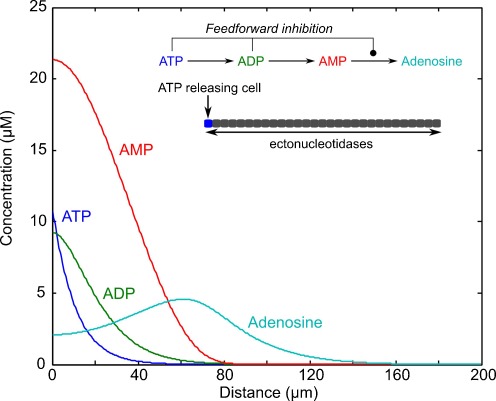
Components of purinergic signalling are expressed in the early embryo raising the possibility that ATP, ADP and adenosine may contribute to the mechanisms of embryonic development. We summarize the available data from four developmental models-mouse, chick, Xenopus and zebrafish. While there are some notable examples where purinergic signalling is indeed important during development, e.g. development of the eye in the frog, it is puzzling that deletion of single components of purinergic signalling often results in rather minor developmental phenotypes. We suggest that a key step in further analysis is to perform combinatorial alterations of expression of purinergic signalling components to uncover their roles in development. We introduce the concept that purinergic signalling could create novel morphogenetic fields to encode spatial location via the concentration of ATP, ADP and adenosine. We show that using minimal assumptions and the known properties of the ectonucleotidases, complex spatial patterns of ATP and adenosine can be set up. These patterns may provide a new way to assess the potential of purinergic signalling in developmental processes.
Figures

Similar articles
-
Purinergic signalling during development and ageing.Purinergic Signal. 2015 Sep;11(3):277-305. doi: 10.1007/s11302-015-9452-9. Epub 2015 May 20. Purinergic Signal. 2015. PMID: 25989750 Free PMC article. Review.
-
Purine-mediated signalling triggers eye development.Nature. 2007 Oct 25;449(7165):1058-62. doi: 10.1038/nature06189. Nature. 2007. PMID: 17960245
-
Purinergic signalling: past, present and future.Braz J Med Biol Res. 2009 Jan;42(1):3-8. doi: 10.1590/s0100-879x2008005000037. Epub 2008 Oct 3. Braz J Med Biol Res. 2009. PMID: 18853040 Review.
-
Potential therapeutic targets in the rapidly expanding field of purinergic signalling.Clin Med (Lond). 2002 Jan-Feb;2(1):45-53. doi: 10.7861/clinmedicine.2-1-45. Clin Med (Lond). 2002. PMID: 11871639 Free PMC article. Review.
-
Purinergic signaling in embryonic and stem cell development.Cell Mol Life Sci. 2011 Apr;68(8):1369-94. doi: 10.1007/s00018-010-0614-1. Epub 2011 Jan 8. Cell Mol Life Sci. 2011. PMID: 21222015 Free PMC article. Review.
Cited by
-
Purinergic signalling during development and ageing.Purinergic Signal. 2015 Sep;11(3):277-305. doi: 10.1007/s11302-015-9452-9. Epub 2015 May 20. Purinergic Signal. 2015. PMID: 25989750 Free PMC article. Review.
-
Integrated Metabolomic and Transcriptomic Analysis Revealed the Mechanism of BHPF Exposure in Endometrium.Toxics. 2025 Jan 27;13(2):100. doi: 10.3390/toxics13020100. Toxics. 2025. PMID: 39997915 Free PMC article.
-
Understanding the Role of ATP Release through Connexins Hemichannels during Neurulation.Int J Mol Sci. 2023 Jan 21;24(3):2159. doi: 10.3390/ijms24032159. Int J Mol Sci. 2023. PMID: 36768481 Free PMC article.
-
Role of Ectonucleotidases in Synapse Formation During Brain Development: Physiological and Pathological Implications.Curr Neuropharmacol. 2019;17(1):84-98. doi: 10.2174/1570159X15666170518151541. Curr Neuropharmacol. 2019. PMID: 28521702 Free PMC article. Review.
-
Impacts of low birthweight on kidney development and intergenerational growth of the offspring.iScience. 2024 Oct 12;27(11):111159. doi: 10.1016/j.isci.2024.111159. eCollection 2024 Nov 15. iScience. 2024. PMID: 39524353 Free PMC article.
References
-
- Khakh BS, Burnstock G, Kennedy C, King BF, North RA, Seguela P, Voigt M, Humphrey PP. International union of pharmacology. XXIV. Current status of the nomenclature and properties of P2X receptors and their subunits. Pharmacol Rev. 2001;53:107–118. - PubMed
-
- Abbracchio MP, Burnstock G, Boeynaems JM, Barnard EA, Boyer JL, Kennedy C, Knight GE, Fumagalli M, Gachet C, Jacobson KA, Weisman GA. International Union of Pharmacology LVIII: update on the P2Y G protein-coupled nucleotide receptors: from molecular mechanisms and pathophysiology to therapy. Pharmacol Rev. 2006;58:281–341. doi: 10.1124/pr.58.3.3. - DOI - PMC - PubMed
Publication types
MeSH terms
Substances
Grants and funding
LinkOut - more resources
Full Text Sources
