. 2012 Jan 24;4(2):90-8.
doi: 10.1038/nchem.1243.

Quantifying the chemical beauty of drugs

Affiliations

Quantifying the chemical beauty of drugs

G Richard Bickerton et al. Nat Chem. .

Abstract

Drug-likeness is a key consideration when selecting compounds during the early stages of drug discovery. However, evaluation of drug-likeness in absolute terms does not reflect adequately the whole spectrum of compound quality. More worryingly, widely used rules may inadvertently foster undesirable molecular property inflation as they permit the encroachment of rule-compliant compounds towards their boundaries. We propose a measure of drug-likeness based on the concept of desirability called the quantitative estimate of drug-likeness (QED). The empirical rationale of QED reflects the underlying distribution of molecular properties. QED is intuitive, transparent, straightforward to implement in many practical settings and allows compounds to be ranked by their relative merit. We extended the utility of QED by applying it to the problem of molecular target druggability assessment by prioritizing a large set of published bioactive compounds. The measure may also capture the abstract notion of aesthetics in medicinal chemistry.


Figures
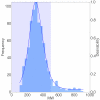
Figure 1
Figure 1. Histograms of 8 selected molecular properties for a set of 771 orally absorbed small molecule drugs
The solid blue line describes the Asymmetric Double Sigmoidal (ADS) functions (Equation 2) used to model the histogram. The parameters for each function are shown in Supplementary Table 1. The Lipinski compliant areas are shown in pale blue in Figures 1 (a), (b), (c) and (d). The molecular properties are: (a) Molecular Weight (MW), (b) Lipophilicity estimated by atomic based prediction of octanol-water partition coefficient (ALOGP), (c) number of hydrogen bond donors (HBD), (d) number of hydrogen bond acceptors (HBA), (e) polar surface area (PSA), (f) number of rotatable bonds (ROTB), (g) number of aromatic rings (AROM) and (h) number of structural alerts (ALERTS).
Figure 2
Figure 2. Benchmarking of QED against other measures of druglikeness
(a) ROC curve (Receiver operating characteristic) of true positive rate (sensitivity) against false positive rate (1-specificity) describing the difference in performance of different approaches in classifying compounds as druglike or otherwise. The performance of the rules of Lipinski, Veber and Ghose, Gleeson (4/400), Congreve (Ro3), Hughes and the quantitative method of Gleeson is compared to three different QED weighting schemes (maximal entropy (QEDwmax), mean optimal entropy (QEDwmo) and unweighted (QEDwu)). Veber et al. observed that compounds with fewer than 10 rotatable bonds and Polar Surface Area (PSA) less than or equal to 140Å2 (or fewer than or equal to 12 hydrogen donors and acceptors) had an increased oral bioavailability in rats. Ghose et al. suggested a qualifying range that could be used in the development of druglike chemical libraries and recommended the following constraints: molecular weight between 160 and 480; calculated logP between -0.4 and 5.6; molar refractivity between 40 and 130 and total number of atoms between 20 and 70. Gleeson et al. has proposed the most desirable region for ADME properties lies between MW<400 and AlogP<4 and recently suggested a quantitative ADMET score based on molecular weight and AlogP . For comparison the ‘Rule of Three’ for fragment selection (Ro3) is also plotted (where MW <300, AlogP ≤3, PSA ≤60, the number of hydrogen bond donors ≤3, the number of hydrogen bond acceptors ≤3). At a threshold that provides an equivalent level of sensitivity as the Ro5, a QEDwmo of 0.40 offers 48% greater specificity than the Ro5. Equally, for the same degree of specificity as the Ro5 a QEDwmo of 0.26 offers 12% greater sensitivity. The dashed line represents the line of no discrimination – the level of performance that would be achieved by a random guess. (b) Direct comparison of Ro5 and QED. Drugs failing (red) and passing (blue) Lipinski’s Ro5. (c) Equivalent plot of the QED results of the same set of compounds. The overlapping distributions indicate the greater resolution provided by the quantitative measure – some rather druglike Lipinski failures are observed as are some undruglike passes. (d) QED distribution for three small molecule databases: the ChEMBL database of small molecule bioactivities (green), small molecule ligands from the PDB (red) and the set of oral drugs used to derive the functions (blue). Both weighted (QEDwmo) (solid lines) and unweighted (QEDwu) (dashed line) indices are shown.
Figure 3
Figure 3. Chemical aesthetics
Illustrative subsets of the oral drugs from DrugStore. (a) The 5 most druglike drugs. (b) The 5 least druglike drugs. (c) The 5 most druglike Ro5 failures. (d) The 5 least druglike Ro5 passes (also see Supplementary Figure 8). (e) Results of chemical survey: QED distributions between compounds annotated chemically attractive and unattractive. (f) Cumulative QED distribution of chemical survey results.
Figure 4
Figure 4. Structural diversity networks
In each of the networks compounds are represented as nodes and are coloured by their respective QED values. An edge connects nodes if they are structurally similar (defined by a Tanimoto threshold of >= 0.7). The networks provide a useful way of summarizing a large amount of data describing the published bioactivity data for a target in an intuitive and visually digestible form. The four targets were chosen as they each have a considerable number of associated compounds but illustrate the importance of considering druglikeness and chemical diversity when prioritizing targets. (a) Structural diversity network for matriptase, a target whose associated bioactive compounds are neither druglike nor diverse. (b) Structural diversity network for plasminogen, a target whose published bioactive compounds are diverse but not druglike. (c) Structural diversity network for 1-acylglycerol-3-phosphate O-acyltransferase beta, a target whose published bioactive compounds are druglike but not diverse. (d) Structural diversity network for norepinephrine transporter, a target whose published bioactive compounds are both druglike and diverse. The network images are generated by the open source graph visualization software GraphViz.

Comment in

References

    1. Keller TH, Pichota A, Yin Z. A practical view of ‘druggability’. Curr. Opin. Chem. Biol. 2006;10:357–361. - PubMed
    1. Ursu O, Rayan A, Goldblum A, Oprea TI. Understanding drug-likeness. Wiley Interdis. Rev.: Comp. Mol. Sci. 2011;1 doi: 10.1002/wcms.1052.
    1. Oprea TI. Property distribution of drug-related chemical databases. J. Comput. Aided Mol. Des. 2000;14:251–264. - PubMed
    1. Leeson PD, Springthorpe B. The influence of drug-like concepts on decision-making in medicinal chemistry. Nature Rev. Drug Discov. 2007;6:881–890. - PubMed
    1. Lipinski CA, Lombardo F, Dominy BW, Feeney PJ. Experimental and computational approaches to estimate solubility and permeability in drug discovery and development settings. Adv. Drug Del. Revs. 1997;23:3–25. - PubMed

Publication types

MeSH terms

Substances