

Magnetic resonance imaging of glutamate
- PMID: 22270722
- PMCID: PMC3274604
- DOI: 10.1038/nm.2615
Magnetic resonance imaging of glutamate
Abstract
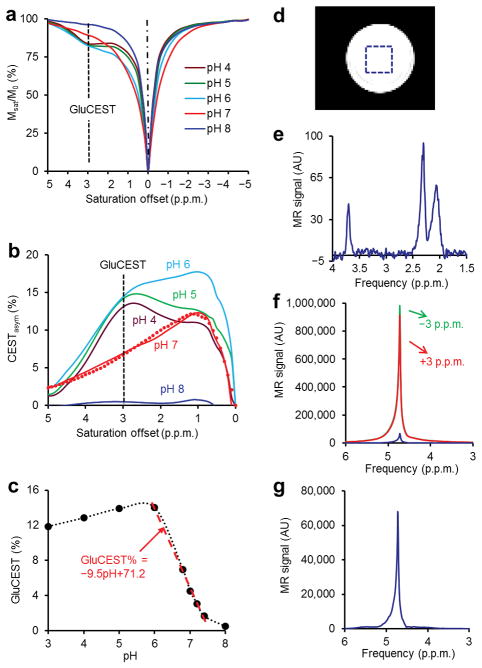
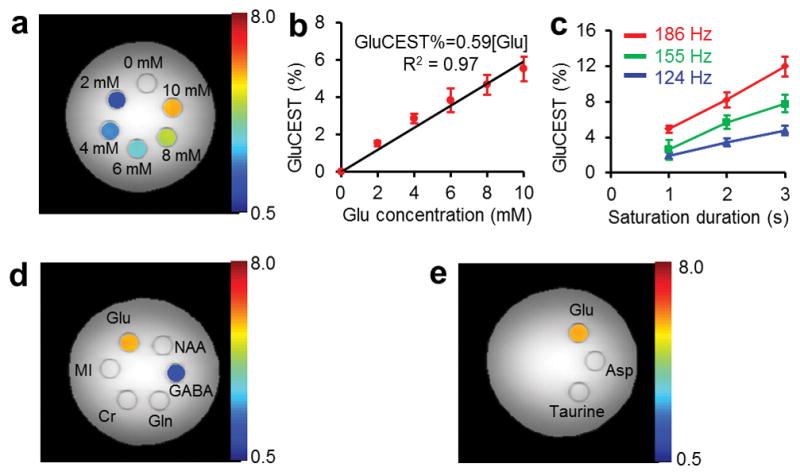
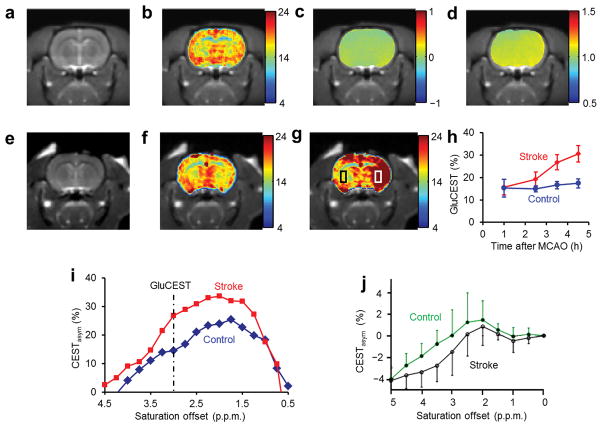
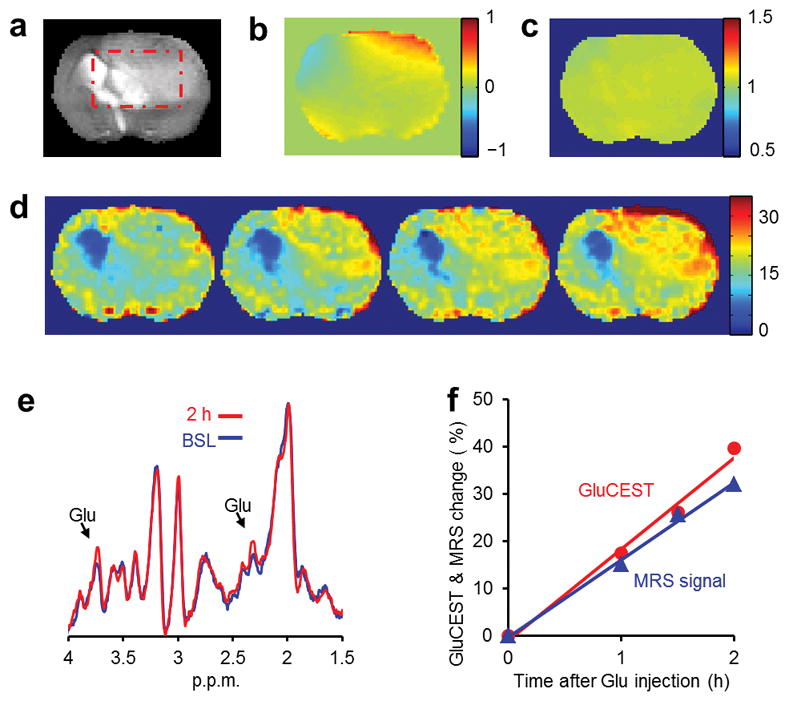
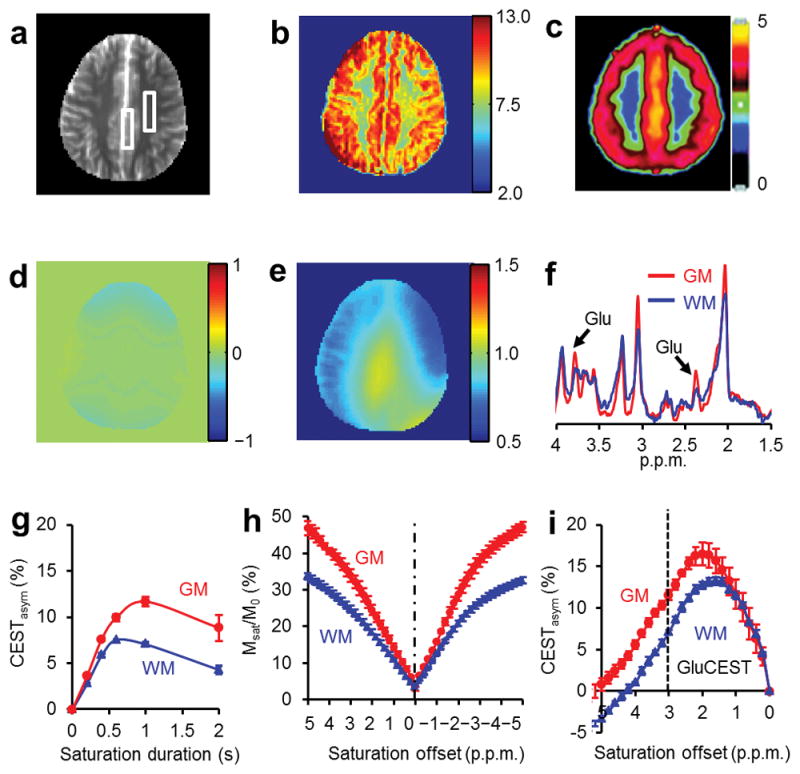
Glutamate, a major neurotransmitter in the brain, shows a pH- and concentration-dependent chemical exchange saturation transfer effect (GluCEST) between its amine group and bulk water, with potential for in vivo imaging by nuclear magnetic resonance. GluCEST asymmetry is observed ∼3 p.p.m. downfield from bulk water. Middle cerebral artery occlusion in the rat brain resulted in an ∼100% elevation of GluCEST in the ipsilateral side compared with the contralateral side, predominantly owing to pH changes. In a rat brain tumor model with blood-brain barrier disruption, intravenous glutamate injection resulted in a clear elevation of GluCEST and a similar increase in the proton magnetic resonance spectroscopy signal of glutamate. GluCEST maps from healthy human brain were also obtained. These results demonstrate the feasibility of using GluCEST for mapping relative changes in glutamate concentration, as well as pH, in vivo. Contributions from other brain metabolites to the GluCEST effect are also discussed.
Figures
Similar articles
-
Mapping the Changes of Glutamate Using Glutamate Chemical Exchange Saturation Transfer (GluCEST) Technique in a Traumatic Brain Injury Model: A Longitudinal Pilot Study.ACS Chem Neurosci. 2019 Jan 16;10(1):649-657. doi: 10.1021/acschemneuro.8b00482. Epub 2018 Oct 25. ACS Chem Neurosci. 2019. PMID: 30346712
-
Cerebral mapping of glutamate using chemical exchange saturation transfer imaging in a rat model of stress-induced sleep disturbance at 7.0T.J Magn Reson Imaging. 2019 Dec;50(6):1866-1872. doi: 10.1002/jmri.26769. Epub 2019 Apr 29. J Magn Reson Imaging. 2019. PMID: 31033089
-
Glutamate-Weighted CEST Contrast After Removal of Magnetization Transfer Effect in Human Brain and Rat Brain with Tumor.Mol Imaging Biol. 2020 Aug;22(4):1087-1101. doi: 10.1007/s11307-019-01465-9. Mol Imaging Biol. 2020. PMID: 31907844
-
Glutamate-weighted CEST (gluCEST) imaging for mapping neurometabolism: An update on the state of the art and emerging findings from in vivo applications.NMR Biomed. 2023 Jun;36(6):e4780. doi: 10.1002/nbm.4780. Epub 2022 Jul 4. NMR Biomed. 2023. PMID: 35642353 Review.
-
In vivo N-15 MRS study of glutamate metabolism in the rat brain.Anal Biochem. 2017 Jul 15;529:179-192. doi: 10.1016/j.ab.2016.08.025. Epub 2016 Aug 28. Anal Biochem. 2017. PMID: 27580850 Free PMC article. Review.
Cited by
-
Effect of Ketamine on Human Neurochemistry in Posterior Cingulate Cortex: A Pilot Magnetic Resonance Spectroscopy Study at 3 Tesla.Front Neurosci. 2021 Mar 24;15:609485. doi: 10.3389/fnins.2021.609485. eCollection 2021. Front Neurosci. 2021. PMID: 33841073 Free PMC article.
-
N-Aryl Amides as Chemical Exchange Saturation Transfer Magnetic Resonance Imaging Contrast Agents.Chemistry. 2020 Sep 10;26(51):11705-11709. doi: 10.1002/chem.202002415. Epub 2020 Aug 11. Chemistry. 2020. PMID: 32639618 Free PMC article.
-
High-field ex vivo and in vivo two-dimensional nuclear magnetic resonance spectroscopy in murine brain: Resolving and exploring the molecular environment.NMR Biomed. 2023 Feb;36(2):e4833. doi: 10.1002/nbm.4833. Epub 2022 Oct 19. NMR Biomed. 2023. PMID: 36114827 Free PMC article.
-
A meta-analysis of ultra-high field glutamate, glutamine, GABA and glutathione 1HMRS in psychosis: Implications for studies of psychosis risk.Schizophr Res. 2020 Dec;226:61-69. doi: 10.1016/j.schres.2020.06.028. Epub 2020 Jul 25. Schizophr Res. 2020. PMID: 32723493 Free PMC article. Review.
-
Deep learning for dense Z-spectra reconstruction from CEST images at sparse frequency offsets.Front Neurosci. 2024 Jan 5;17:1323131. doi: 10.3389/fnins.2023.1323131. eCollection 2023. Front Neurosci. 2024. PMID: 38249588 Free PMC article.
References
-
- Petroff OA. GABA and glutamate in the human brain. Neuroscientist. 2002;8:562–573. - PubMed
-
- Harrison PJ. Metabotropic glutamate receptor agonists for schizophrenia. Br J Psychiatry. 2008;192:86–87. - PubMed
-
- Paul IA, Skolnick P. Glutamate and depression: clinical and preclinical studies. Ann N Y Acad Sci. 2003;1003:250–272. - PubMed
-
- Chojnacka-Wojcik E, Klodzinska A, Pilc A. Glutamate receptor ligands as anxiolytics. Curr Opin Investig Drugs. 2001;2:1112–1119. - PubMed
Publication types
MeSH terms
Substances
Grants and funding
LinkOut - more resources
Full Text Sources
Other Literature Sources
Medical
