Review
. 2012 Jan 23;196(2):189-201.
doi: 10.1083/jcb.201103008.

The Ras protein superfamily: evolutionary tree and role of conserved amino acids

Affiliations
Review

The Ras protein superfamily: evolutionary tree and role of conserved amino acids

Ana Maria Rojas et al. J Cell Biol. .

Erratum in

  • J Cell Biol. 2012 Feb 20;196(4):545

Abstract

The Ras superfamily is a fascinating example of functional diversification in the context of a preserved structural framework and a prototypic GTP binding site. Thanks to the availability of complete genome sequences of species representing important evolutionary branch points, we have analyzed the composition and organization of this superfamily at a greater level than was previously possible. Phylogenetic analysis of gene families at the organism and sequence level revealed complex relationships between the evolution of this protein superfamily sequence and the acquisition of distinct cellular functions. Together with advances in computational methods and structural studies, the sequence information has helped to identify features important for the recognition of molecular partners and the functional specialization of different members of the Ras superfamily.


Figures

Figure 1.
Figure 1.
The orthologues of the human Ras superfamily members in 11 proteomes. Heat map colors indicate the number of the orthologues corresponding to human sequences in a particular species. Numbers inside the boxes indicate the number of orthologous human sequences in the Ras superfamily. Dashes inside the boxes indicate the absence of proteins. Orange numbers in the tree indicate millions of years according to a recently revised scale (Hedges et al., 2004) and the time line is an approximate scale for the purposes of illustration. Arrowheads point to important splits that occurred in the course of evolution. The classical families are represented and for the purpose of clarity, the Ran family and the “unclassified” sequences including SRPRBs, RABL5, and RABL3 proteins are shown independently. The MIRO and RAYL proteins are included in the Rho family and the RABL2 proteins (one per organism) in the Rab family. Numbers on the right of the table indicate G-domain–containing proteins extracted from the PFAM database, therefore some discrepancies are expected due to variability in the synchronization of PFAM and Uniprot databases. Asterisk indicates well-annotated sequences in complete genomes and the associated number reflects the Ras superfamily sequences obtained from PFAM. “#” indicates the presence of the RAS domain in either draft genomes or complete but poorly annotated sequences, and the associated number represents the sequences (fragments have been removed) extracted from PFAM (Finn et al., 2010) in which the G-domain has been identified. Plants: Ath (Arabidopsis thaliana); Alveolata: Pfa (Plasmodium falciparum); Fungi: Spo (Schizosaccharomyces pombe); Yeast: Sce (Saccharomyces cerevisiae); Radiate: Nve (Nematostella vectensis); Worm: Cel (Caenorhabditis elegans); Fly: Dme (Drosophila melanogaster); Lanceolet: Bfl (Brachiostoma floridae, protochordata); Ascidian: Cin (Ciona intestinalis, urochordata); Xtr (Xenopus tropicalis); Human: Hsa (Homo sapiens); and Mouse: Mus (Mus musculus).
Figure 2.
Figure 2.
Consensus phylogenetic tree of selected Ras superfamily members rooted with outliers. The 165 proteins selected after careful individual analyses (see Figs. S1–S5) of species-trees and gene-trees covering the Ras superfamily sequences, plus three sequences (human mitochondrial, plant chloroplast, and bacterial) of representative Elongation factor Tu (a remote homologue of Ras superfamily) used to root the tree, were aligned to the G-domain (see main text). The tree is a consensus of more than 126,769 sampled trees with their associated probabilities. The numbers in brackets indicate stable groups; *, absent in Plants and alveolates; **, absent in alveolates. The founder members are the SRPRB group (1) and the Arf family (2). RABL5 (3; Wu et al., 2002) and RABL3 (4) appear at the basal branches of the Ras family (most likely as founders). This phylogeny proposes SRPRB and the Arf family to be the founder members of the classical Ras superfamily. Underlined names indicate the 22 human sequences. Plants: ARATH (Arabidopsis thaliana); Alveolata: PLAF7 (Plasmodium falciparum); Fungi: SCHPO (Schizosaccharomyces pombe); Yeast: Sce (Saccharomyces cerevisiae); Radiate: Nve (Nematostella vectensis); Worm: CAEEL (Caenorhabditis elegans); Fly: DROME (Drosophila melanogaster); Lanceolet: Bfl (Brachiostoma floridae, protochordata); Ascidian: Cin (Ciona intestinalis, urochordata); Xtr (Xenopus tropicalis); Human (Homo sapiens); and Mouse (Mus musculus).
Figure 3.
Figure 3.
Phylogenetic tree of the human Ras superfamily. Of the 167 sequences defined (Table S2), some proteins are identical in the G-domain while exhibiting differences in other regions of the protein. Thus, identical sequences were removed before performing the alignments. The tree contains 151 sequences that correspond to bona fide unique protein sequences (Table S2) that were aligned with the G-domain profile (PF00071, also RAS) to define the domain boundaries. The alignment was used as the input to generate the probabilistic phylogeny using a Bayesian inference (Ronquist and Huelsenbeck, 2003). Thus, 29,340 trees were sampled and the associated confidence values (group probability values) were obtained for each group. The numbers in brackets indicate the equivalent group numbering, as in Fig. 2. The background colors indicate the original classification (Wennerberg et al., 2005): blue, Ras family; green, Rho; red, Rab; cyan, Arf; and yellow, Ran. Unclassified members are shown in beige. Gray circles indicate group probabilities >80% (confidence value assigned to a group and expressed as a percentage). The white font indicates the archetypal Ras family proteins and the names underlined indicate the human sequences from Fig. 2. The tree was visualized with iTOL (Letunic and Bork, 2007).
Figure 4.
Figure 4.
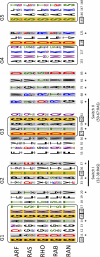
Specificity-determining positions (SDPs). These residues are displayed in sequence logos corresponding to the different Ras superfamily members and represented in the context of the characteristic G-boxes. The positions are numbered according to the corresponding residue in PDB 121P (H-Ras-1). The SDPs detected according to the classical scenario (the distribution in the classical five subfamilies, Ras, Rab, Ran, Rho, and Arf) are indicated by an asterisk and highlighted against a gray background. The conserved positions are marked with a square and shown on an orange background. The relative size of the amino acid letters in the logos represents the raw frequency for the alignment of the 919 sequences (Table S1), colored as follows: green (polar: S,T,Y,C,Q,N); blue (basic: K,R,H); red (acidic: D,E) and black: G and hydrophobic (A,V,L,I,P,W,F,M). Logos were generated using Weblogo3 (http://weblogo.threeplusone.com; Crooks et al., 2004) and the switch regions are indicated below in the G-boxes.
Figure 5.
Figure 5.
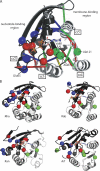
Location of the SDPs for the different Ras superfamily proteins. (A) SDP residues in the RAS subfamily. The SDPs (Table 1) are shown as spheres. In the RAS protein the three different isoform-specific contacts are indicated by red, blue, and green lines for NRAS, KRAS, and HRAS, respectively. The proposed routes of communication between lobes 1 and 2 linking the nucleotide-binding region with the membrane-binding region are shown in dark gray and pale gray cartoon. (B) SDP residues for the different Ras subfamilies. The SDPs (Table 1) are mapped onto the structure of representative members (Rho, Rab, Ran, and Arf in the four panels). In both panels the colored spheres indicate SDPs mapped into structures. Red: residues in the proximity of the GTP/GDP-binding pocket. Blue: residues involved in protein–protein interaction. Green: SDP residues coordinating the communication between lobes (see explanation in the text). Gray: residues with no identified biological function. Equivalent regions potentially involved in communication between lobes 1 and 2 linking the nucleotide-binding region with the membrane-binding region are shown in dark gray and pale gray cartoon.

Similar articles

Cited by

References

    1. Abankwa D., Hanzal-Bayer M., Ariotti N., Plowman S.J., Gorfe A.A., Parton R.G., McCammon J.A., Hancock J.F. 2008. A novel switch region regulates H-ras membrane orientation and signal output. EMBO J. 27:727–735 10.1038/emboj.2008.10 - DOI - PMC - PubMed
    1. Azuma Y., Renault L., García-Ranea J.A., Valencia A., Nishimoto T., Wittinghofer A. 1999. Model of the ran-RCC1 interaction using biochemical and docking experiments. J. Mol. Biol. 289:1119–1130 10.1006/jmbi.1999.2820 - DOI - PubMed
    1. Barnekow A., Thyrock A., Kessler D. 2009. Chapter 5: rab proteins and their interaction partners. Int Rev Cell Mol Biol. 274:235–274 10.1016/S1937-6448(08)02005-4 - DOI - PubMed
    1. Bauer B., Mirey G., Vetter I.R., García-Ranea J.A., Valencia A., Wittinghofer A., Camonis J.H., Cool R.H. 1999. Effector recognition by the small GTP-binding proteins Ras and Ral. J. Biol. Chem. 274:17763–17770 10.1074/jbc.274.25.17763 - DOI - PubMed
    1. Biou V., Cherfils J. 2004. Structural principles for the multispecificity of small GTP-binding proteins. Biochemistry. 43:6833–6840 10.1021/bi049630u - DOI - PubMed

Publication types