

Novel plant SUN-KASH bridges are involved in RanGAP anchoring and nuclear shape determination
- PMID: 22270916
- PMCID: PMC3265956
- DOI: 10.1083/jcb.201108098
Novel plant SUN-KASH bridges are involved in RanGAP anchoring and nuclear shape determination
Abstract
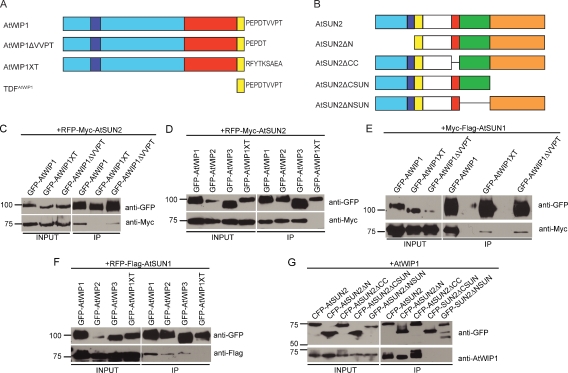
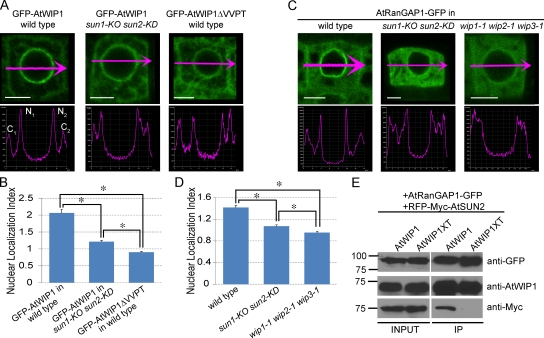
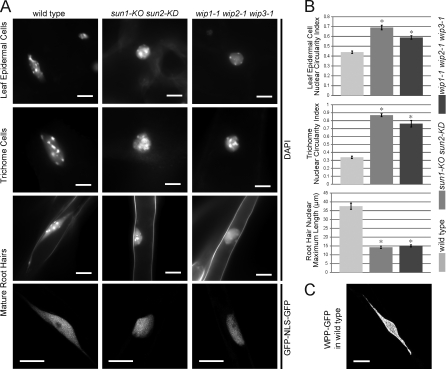
Inner nuclear membrane Sad1/UNC-84 (SUN) proteins interact with outer nuclear membrane (ONM) Klarsicht/ANC-1/Syne homology (KASH) proteins, forming linkers of nucleoskeleton to cytoskeleton conserved from yeast to human and involved in positioning of nuclei and chromosomes. Defects in SUN-KASH bridges are linked to muscular dystrophy, progeria, and cancer. SUN proteins were recently identified in plants, but their ONM KASH partners are unknown. Arabidopsis WPP domain-interacting proteins (AtWIPs) are plant-specific ONM proteins that redundantly anchor Arabidopsis RanGTPase-activating protein 1 (AtRanGAP1) to the nuclear envelope (NE). In this paper, we report that AtWIPs are plant-specific KASH proteins interacting with Arabidopsis SUN proteins (AtSUNs). The interaction is required for both AtWIP1 and AtRanGAP1 NE localization. AtWIPs and AtSUNs are necessary for maintaining the elongated nuclear shape of Arabidopsis epidermal cells. Together, our data identify the first KASH members in the plant kingdom and provide a novel function of SUN-KASH complexes, suggesting that a functionally diverged SUN-KASH bridge is conserved beyond the opisthokonts.
Figures


Similar articles
-
Identification of unique SUN-interacting nuclear envelope proteins with diverse functions in plants.J Cell Biol. 2014 Jun 9;205(5):677-92. doi: 10.1083/jcb.201401138. Epub 2014 Jun 2. J Cell Biol. 2014. PMID: 24891605 Free PMC article.
-
Plant nuclear shape is independently determined by the SUN-WIP-WIT2-myosin XI-i complex and CRWN1.Nucleus. 2015;6(2):144-53. doi: 10.1080/19491034.2014.1003512. Epub 2015 Mar 11. Nucleus. 2015. PMID: 25759303 Free PMC article.
-
UNC-83 IS a KASH protein required for nuclear migration and is recruited to the outer nuclear membrane by a physical interaction with the SUN protein UNC-84.Mol Biol Cell. 2006 Apr;17(4):1790-801. doi: 10.1091/mbc.e05-09-0894. Epub 2006 Feb 15. Mol Biol Cell. 2006. PMID: 16481402 Free PMC article.
-
Interactions between nuclei and the cytoskeleton are mediated by SUN-KASH nuclear-envelope bridges.Annu Rev Cell Dev Biol. 2010;26:421-44. doi: 10.1146/annurev-cellbio-100109-104037. Annu Rev Cell Dev Biol. 2010. PMID: 20507227 Free PMC article. Review.
-
The plant nuclear envelope as a multifunctional platform LINCed by SUN and KASH.J Exp Bot. 2015 Mar;66(6):1649-59. doi: 10.1093/jxb/erv082. Epub 2015 Mar 4. J Exp Bot. 2015. PMID: 25740919 Review.
Cited by
-
Protein interactions at the higher plant nuclear envelope: evidence for a linker of nucleoskeleton and cytoskeleton complex.Front Plant Sci. 2014 May 7;5:183. doi: 10.3389/fpls.2014.00183. eCollection 2014. Front Plant Sci. 2014. PMID: 24847341 Free PMC article. Review.
-
Distinct Roles for KASH Proteins SINE1 and SINE2 in Guard Cell Actin Reorganization, Calcium Oscillations, and Vacuolar Remodeling.Front Plant Sci. 2022 May 6;13:784342. doi: 10.3389/fpls.2022.784342. eCollection 2022. Front Plant Sci. 2022. PMID: 35599883 Free PMC article.
-
MLKS2 is an ARM domain and F-actin-associated KASH protein that functions in stomatal complex development and meiotic chromosome segregation.Nucleus. 2019 Dec;10(1):144-166. doi: 10.1080/19491034.2019.1629795. Nucleus. 2019. PMID: 31221013 Free PMC article.
-
Nuclei in motion: movement and positioning of plant nuclei in development, signaling, symbiosis, and disease.Front Plant Sci. 2014 Apr 3;5:129. doi: 10.3389/fpls.2014.00129. eCollection 2014. Front Plant Sci. 2014. PMID: 24772115 Free PMC article. Review.
-
Identification of unique SUN-interacting nuclear envelope proteins with diverse functions in plants.J Cell Biol. 2014 Jun 9;205(5):677-92. doi: 10.1083/jcb.201401138. Epub 2014 Jun 2. J Cell Biol. 2014. PMID: 24891605 Free PMC article.
References
Publication types
MeSH terms
Substances
LinkOut - more resources
Full Text Sources
Other Literature Sources
Molecular Biology Databases
Research Materials
