. 2012 Feb 13;209(2):275-89.
doi: 10.1084/jem.20111117. Epub 2012 Jan 23.

Inhibiting the HSP90 chaperone destabilizes macrophage migration inhibitory factor and thereby inhibits breast tumor progression

Affiliations

Inhibiting the HSP90 chaperone destabilizes macrophage migration inhibitory factor and thereby inhibits breast tumor progression

Ramona Schulz et al. J Exp Med. .

Erratum in

  • J Exp Med. 2012 Mar 12;209(3):640

Abstract

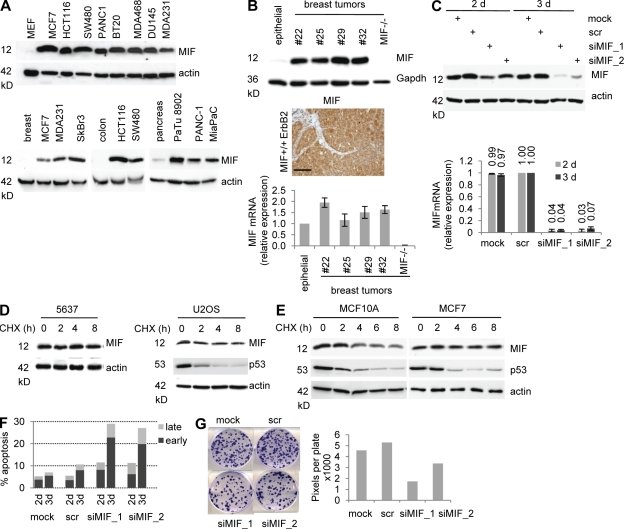
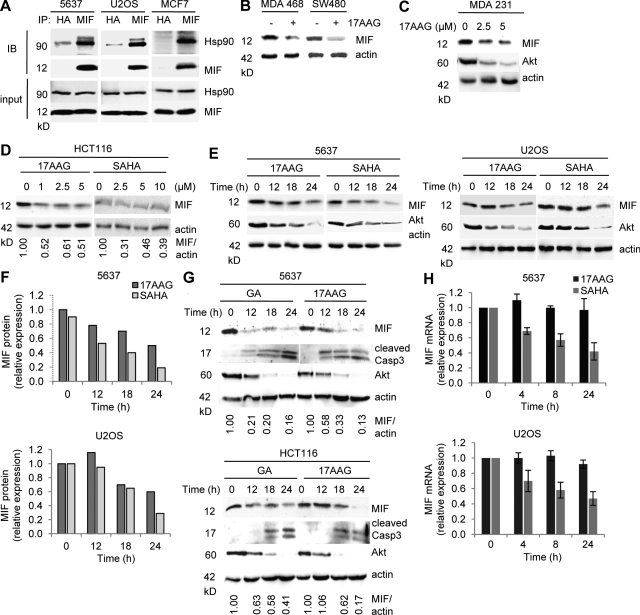
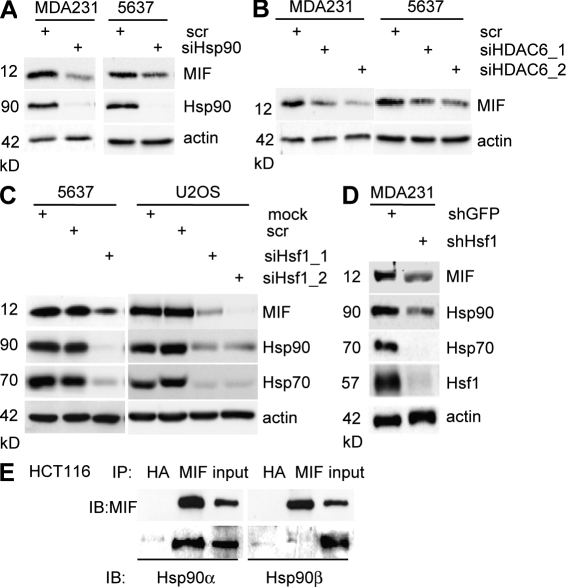
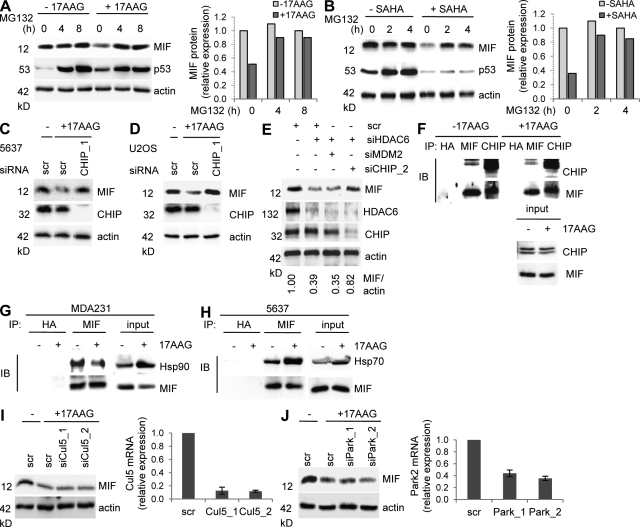
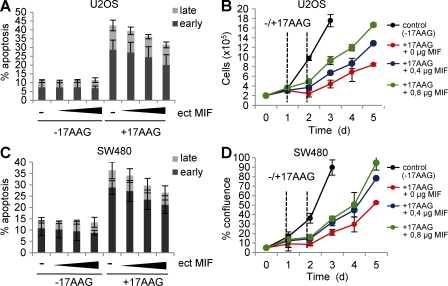
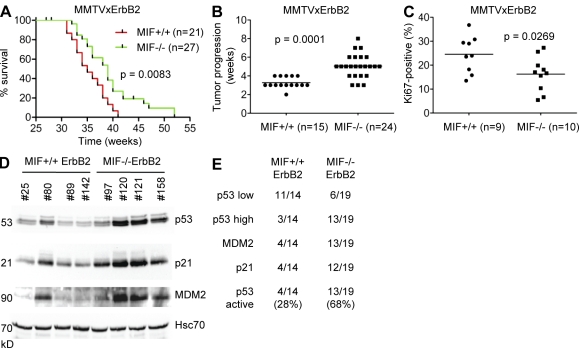
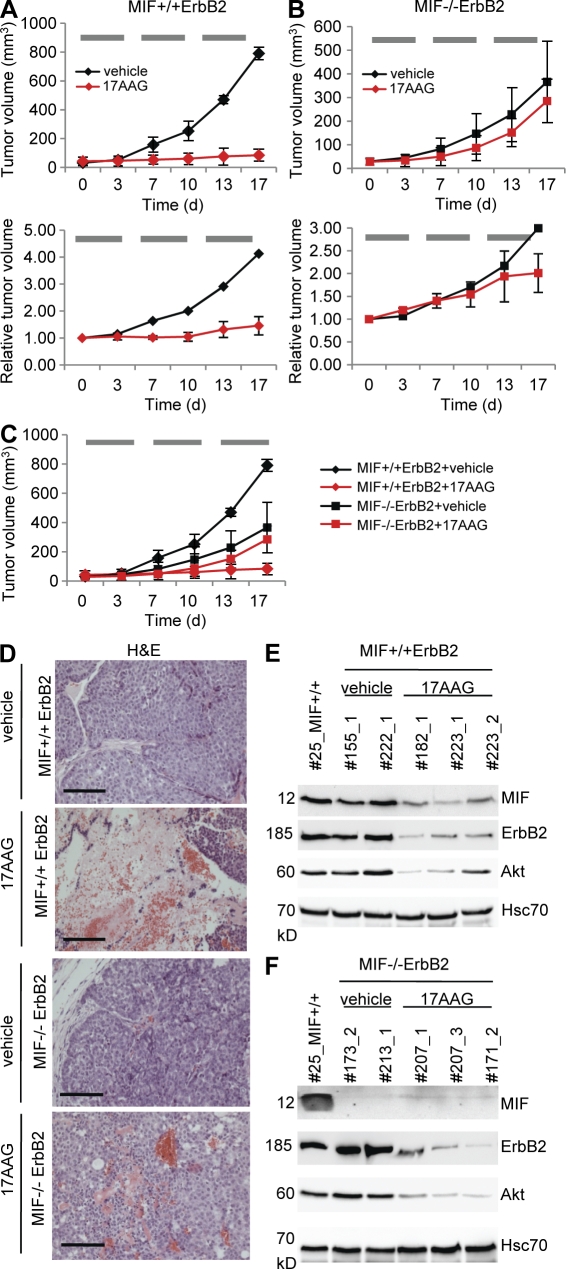
Intracellular macrophage migration inhibitory factor (MIF) often becomes stabilized in human cancer cells. MIF can promote tumor cell survival, and elevated MIF protein correlates with tumor aggressiveness and poor prognosis. However, the molecular mechanism facilitating MIF stabilization in tumors is not understood. We show that the tumor-activated HSP90 chaperone complex protects MIF from degradation. Pharmacological inhibition of HSP90 activity, or siRNA-mediated knockdown of HSP90 or HDAC6, destabilizes MIF in a variety of human cancer cells. The HSP90-associated E3 ubiquitin ligase CHIP mediates the ensuing proteasome-dependent MIF degradation. Cancer cells contain constitutive endogenous MIF-HSP90 complexes. siRNA-mediated MIF knockdown inhibits proliferation and triggers apoptosis of cultured human cancer cells, whereas HSP90 inhibitor-induced apoptosis is overridden by ectopic MIF expression. In the ErbB2 transgenic model of human HER2-positive breast cancer, genetic ablation of MIF delays tumor progression and prolongs overall survival of mice. Systemic treatment with the HSP90 inhibitor 17AAG reduces MIF expression and blocks growth of MIF-expressing, but not MIF-deficient, tumors. Together, these findings identify MIF as a novel HSP90 client and suggest that HSP90 inhibitors inhibit ErbB2-driven breast tumor growth at least in part by destabilizing MIF.


Figures

Figure 1.
Figure 1.
MIF protein is stabilized in human and mouse cancer cells. (A, Top) Representative immunoblot of cell lysates from the indicated human cancer cell lines compared with normal primary MEF (20 µg protein per lane). (A, Bottom) Lysates from normal human tissues (breast, colon, and pancreas) were compared with human cancer cell lines derived from the corresponding tissue types. Representative immunoblots for MIF. Actin, loading control. (B, Top) Total tissue lysates from primary breast tumors from transgenic MMTV-ErbB2 mice (each number indicates a different mouse) were compared with normal mammary epithelial cells isolated from the mammary fat pad (epithelial) by immunoblotting. MIF−/− is a control tumor from an MIF−/−ErbB2 mouse. Gapdh, loading control. (B, Middle) Immunohistochemical MIF staining of MMTV-ErbB2 tumor #25. Bar, 100 µm. Normal mouse mammary tissue contains undetectable level of MIF. (B, Bottom) Quantitative RT-PCR of MIF mRNA normalized to 36B4 mRNA in breast tumors compared with normal tissue. Relative values are given in ratio (2−ddCT). Error bars indicate the mean of two separate RT reactions of triplicates each. Epithelial and MIF−/− controls are as above. (C) Duplicate plates of U2OS cells were transfected with two different siRNAs against MIF, scrambled control siRNA (scr), or mock transfected. At 2 and 3 d after transfection, cells were harvested. Top, immunoblotting of lysates with antibodies against MIF. Bottom, total RNA was analyzed by quantitative RT-PCR. Relative values normalized to GAPDH from ratio (2−ddCT). Error bars indicate the mean of two independent experiments in triplicates each. (D and E) 5637 bladder cancer and U2OS osteosarcoma cells (D) and immortalized MCF10A and MFC7 breast cancer cells (E) were treated with 40 µg/ml CHX for the indicated times. Total cell lysates were immunoblotted for MIF. Actin, loading control. p53, positive control for translational inhibition by CHX. Representative blots from three (D) and two (E) independent experiments are shown. (F) HCT116 cells were transfected with siRNA as in Fig. 1 C. At 2 and 3 d after transfection, cells were stained with Annexin and 7-AAD to determine early and late apoptosis by flow cytometry. Each time point was determined in duplicate and the mean is plotted. (G) HCT116 cells were transfected with siRNA as in Fig. 1 C. At 3 d after transfection, equal numbers of surviving cells were seeded and cultured for 8 d. Cells were fixed, stained with crystal violet, and plates were scanned (left). Colony density was measured as total pixels per plate (right). Representative data from three independent repeats are shown.
Figure 2.
Figure 2.
Hsp90 inhibition by 17AAG and SAHA destabilizes MIF protein in human cancer cells. (A) Untreated 5637, U2OS, and MCF7 human cancer cells were subjected to coimmunoprecipitation with an anti-MIF antibody and immunoblotted as indicated. An anti-HA antibody served as negative precipitation control. (B–D) MDA468 and SW480 (B), MDA231 (C), and HCT116 (D) cells were treated with indicated concentrations of 17AAG or SAHA for 24 h (C and D) or with 5 µM of 17AAG for 24 h (B). Representative immunoblot analyses. Akt serves as positive control for HSP90 inhibition. Actin, loading control. Quantification of immunoblot (D) is shown as relative values (MIF/actin ratio) setting 0 h drug treatment to the value of 1. (E and F) 5637 and U2OS cells were treated with 5 µM 17AAG or SAHA for the indicated times (E). Representative immunoblots from three independent experiments are shown. Akt serves as positive control for Hsp90 inhibition. Actin, loading control. Densitometric evaluations of representative immunoblots from E are shown in F. Each MIF value was normalized to its corresponding actin value. Relative values were calculated by setting control cells at 0 h to 1. (G) 5637 (top) and HCT116 (bottom) cells were treated with 5 µM GA or 17AAG for the indicated time. Cleaved Caspase 3 indicates apoptosis. Representative immunoblots from two independent experiments are shown. Akt, positive control for Hsp90 inhibition. Actin, loading control. Quantification is as in Fig. 2 D. (H) 5637 (top) and U2OS (bottom) cells were treated with 5 µM 17AAG or SAHA for the indicated times. MIF mRNA, measured by quantitative RT-PCR, was normalized to GAPDH ratio (2−ddCT). Error bars indicate the mean of three independent experiments in triplicates each.
Figure 3.
Figure 3.
Depletion of Hsp90, HDAC6, or Hsf1 all destabilize MIF protein. (A and B) MDA231 and 5637 cells were transfected with siRNA against the Hsp90 chaperone (A) or against HDAC6 (two different sequences, siHDAC6_1 and siHDAC6_2; B). After 3 d, MIF and Hsp90 protein levels were assessed by immunoblots. Representative blots from two independent experiments are shown. Actin, loading control. (C and D) 5637 and U2OS cells transfected with two different siRNAs against Hsf1 for 3 d (C), and MDA231 cells stably transfected with an shRNA against Hsf1 were immunoblotted for MIF, Hsp90, Hsp70, and Hsf1 (D). Representative blots from three independent experiments. Actin, loading control. (E) Untreated HCT116 cells were subjected to coimmunoprecipitation with anti-MIF or irrelevant anti-HA antibodies and immunoblotted with isoform-specific Hsp90 antibodies.
Figure 4.
Figure 4.
CHIP ubiquitin E3 ligase is required for MIF degradation after Hsp90 inhibition in cancer cells. (A and B, Left) U2OS cancer cells were left untreated or treated with 5 µM each 17AAG (A) or SAHA (B) for 24 h with or without 10 µM of the proteasome inhibitor MG132 for the indicated final hours. Representative immunoblot analysis from three independent experiments. WT p53 serves as positive control for proteasome inhibition. Actin, loading control. (A and B, Right) Densitometric evaluations of representative immunoblots from the left. Each MIF value was normalized to its corresponding actin value. Relative values were calculated setting control cells at 0 h and without 17AAG to 1. (C and D) 5637 (C) and U2OS (D) cells were transfected with siRNA against CHIP (siCHIP_1) or control siRNA (scr). 2 d after transfection, cells were treated with 5 µM 17AAG for 24 h and MIF stability was analyzed. Representative immunoblots from two independent experiments. Actin, loading control. (E) MDA231 cells were cotransfected with siHDAC6, siMDM2, siCHIP_2, or control siRNA (scr). After 3 d, MIF levels were assessed by immunoblotting. Actin, loading control. The representative immunoblot was quantified and relative values (MIF/actin ratio) were calculated setting scr control to 1. (F) 5637 cells were treated with 5 µM 17AAG for 24 h. MG132 was added for the final 6 h. Whole cell lysates normalized for equal levels of MIF (see input) were immunoprecipitated with anti-MIF, anti-CHIP, or anti-HA control antibody (IP). MIF-bound CHIP and CHIP-bound MIF were detected by immunoblots. (G) MDA231 cells were treated with 5 µM 17AAG for 24 h. Whole cell lysates normalized for equal levels of MIF were immunoprecipitated with anti-MIF or anti-HA control antibody (IP). MIF-bound Hsp90 was detected by immunoblot. (H) 5637 cancer cells were treated as described in Fig 4 F. Whole cell lysates normalized for equal levels of MIF (see input) were immunoprecipitated with anti-MIF or anti-HA control antibody (IP). MIF-bound Hsp70 was detected by immunoblotting. (I and J) U2OS cells were transfected with two different siRNAs against Parkin (G) or Cul5 (H) or with control siRNA (scr). At 2 d after transfection, cells were cultured in parallel with 5 µM 17AAG for 24 h and MIF protein levels were analyzed by immunoblotting (left). Parkin and Cullin 5 mRNA transcripts were measured by quantitative RT-PCRs normalized to GAPDH expression (right, bar graphs). Error bars indicate the mean of two independent experiments in triplicates each.
Figure 5.
Figure 5.
17AAG-induced apoptosis and growth defects are significantly rescued by excess MIF. (A and C) U2OS (A) and SW480 (C) cells were transiently transfected with increasing amounts (indicated as wedges) of MIF expression plasmid (ect MIF) or 0.8 µg empty control vector per well in 12-well plates. At day 1 after transfection, cells were treated with 5 µM 17AAG for 24 h, or left untreated, and stained with Annexin and 7-AAD to count cells in early and late apoptotic cell phases by flow cytometry. Error bars indicate the mean of three independent experiments. (B and D) U2OS (B) and SW480 (D) cells were transiently transfected with MIF expression plasmids as in A and C. At day 1 after transfection, 5 × 10⁴ cells per 12-well plate were seeded (d0) and cultured for another 24 h. Cells were then treated with 5 µM 17AAG for 24 h (time interval indicated by vertical dashed lines) or left untreated. During subsequent culturing, cell numbers (U2OS) or cell confluence (SW480) was measured by CELIGO Cytometer using 49 squares per well. Error bars indicate the mean of two independent experiments in duplicates each. Time is in days (d).
Figure 6.
Figure 6.
In the MMTV-ErbB2 mouse model of breast cancer, genetic MIF loss delays cancer progression by activating p53. (A) Kaplan-Meier survival curves of MIF+/+ErbB2 (n = 21) and MIF−/−ErbB2 (n = 27) mice. Log-rank test, P = 0.0083. Note that 3 of the original 27 MIF−/− ErbB2 mice and 6 of the original 21 MIF+/+ ErbB2 mice were censored because they died from salivary cancers rather than breast cancers. (B) Speed of breast tumor growth/progression in MIF+/+ ErbB2 versus MIF−/− ErbB2 mice, calculated from the time it took from when the first of several tumors in an animal was initially palpable until it had reached the allowable endpoint volume of 900 mm3. Data are shown as scatter plot. Student’s t test, P = 0.0001. Horizontal bars indicate the mean of all values. (C) Ki67 staining of histological sections of MIF+/+ErbB2 (n = 9) and MIF−/−ErbB2 (n = 10) tumors was quantitated using a digital mask (ImageJ software). Eight random fields (20× magnification) of three standardized hematoxylin-counterstained tumor sections per mouse per genotype were counted. The number of Ki67-positive cells was calculated as percentage of total nuclei. Student’s t test, P = 0.0269. Horizontal bars indicate the mean of all values. (D) Lysates from representative tumors of MIF+/+ and MIF−/− ErbB2 mice were analyzed by immunoblot for levels of p53 and its target genes p21 and MDM2. Each number indicates a different mouse. Hcs70, loading control. (E) Summary of all MIF+/+ErbB2 (n = 14) and MIF−/−ErbB2 (n = 19) tumors analyzed by immunoblotting as in Fig. 6 D. Compared with an MIF+/+ reference tumor (tumor #25 in Fig. 6 D and Fig. 1 B), p53 low means the same p53 protein levels and p53 high means higher p53 protein levels. p53 was scored as activated if p53 levels were high and p21 and MDM2 levels were up-regulated.
Figure 7.
Figure 7.
Hsp90 inhibition via systemic 17AAG treatment induces marked growth inhibition in MIF+/+ErbB2 tumors but shows no impact in MIF−/−ErbB2 tumors. (A–C) Median tumor volumes in response to treatment. Time course is in days (d). Mice with small comparably sized breast tumors (mostly <50 mm3; A and B, top) and larger tumors (mostly >200 mm3; A and B, bottom) of MIF+/+ErbB2 (A) and MIF−/−ErbB2 (B) genotypes were treated with intraperitoneal injections of 17AAG (red lines) or vehicle (EPL diluent, black lines) 5 d per week for 3 wk. Horizontal gray bars indicate the time windows of daily 17AAG treatments. During treatment, tumor sizes were monitored twice a week. Top, for small tumors, four independent experiments for treatment/genotype combinations were performed on different days in a total of 22 mice (seven mice in experiment 1; five mice in experiment 2; four mice in experiment 3; and six mice in experiment 4). MIF+/+ErbB2 + vehicle: 5 tumors in 4 mice; MIF+/+ErbB2 + 17AAG: 8 tumors in 5 mice; MIF−/−ErbB2 + vehicle: 9 tumors in 5 mice; MIF−/−ErbB2 + 17AAG: 16 tumors in 8 mice. Each independent experiment was done side by side for all treatment/genotype combinations. For clarity, data are shown separately in A (MIF+/+ErbB2) and B (MIF−/−ErbB2). Overlay of both genotypes is graphed in C. For detailed listing of all small tumors, see Fig. S1. Bottom, larger tumors (mostly > 200 mm3) were analyzed in one experiment side by side in a total of eight mice. For clarity, treatment/genotype combinations are shown separately in A (MIF+/+ErbB2) and B (MIF−/−ErbB2). The response rates of the larger tumors were normalized to their respective starting tumor volumes. As expected, vehicle-treated small and large control tumors showed a similar tumor progression (compare black lines, top and bottom). MIF+/+ErbB2 + vehicle: one tumor in one mouse. MIF+/+ErbB2 + 17AAG: three tumors in three mice. MIF−/−ErbB2 + vehicle: one tumor in one mouse. MIF−/−ErbB2 + 17AAG: three tumors in three mice. For detailed listing of all larger tumors, see Fig. S2. Error bars indicate the mean of all tumors measured per treatment/genotype combination. (D) Tumors from MIF+/+ErbB2 and MIF−/−ErbB2 mice treated with intraperitoneal 17AAG or vehicle were stained by H&E. Bars, 100 µm. (E and F) Mice were sacrificed 8 h after the final dose of intraperitoneal 17AAG or vehicle on day 17 (see A–C) and breast tumors were harvested. Lysates of MIF+/+ErbB2 (E) and MIF−/−ErbB2 tumors (F) treated with 17AAG or vehicle (EPL) were immunoblotted. Effective inhibition of Hsp90 by 17AAG was confirmed by degradation of MIF, ErbB2, and Akt. Hcs70, loading control. Each number indicates a different mouse. Tumor #25 served as reference tumor also used in Figs. 1 B and 6 D.

Similar articles

Cited by

References

    1. Bali P., Pranpat M., Bradner J., Balasis M., Fiskus W., Guo F., Rocha K., Kumaraswamy S., Boyapalle S., Atadja P., et al. 2005. Inhibition of histone deacetylase 6 acetylates and disrupts the chaperone function of heat shock protein 90: a novel basis for antileukemia activity of histone deacetylase inhibitors. J. Biol. Chem. 280:26729–26734 10.1074/jbc.C500186200 - DOI - PubMed
    1. Bando H., Matsumoto G., Bando M., Muta M., Ogawa T., Funata N., Nishihira J., Koike M., Toi M. 2002. Expression of macrophage migration inhibitory factor in human breast cancer: association with nodal spread. Jpn. J. Cancer Res. 93:389–396 10.1111/j.1349-7006.2002.tb01269.x - DOI - PMC - PubMed
    1. Banerji U., Walton M., Raynaud F., Grimshaw R., Kelland L., Valenti M., Judson I., Workman P. 2005. Pharmacokinetic-pharmacodynamic relationships for the heat shock protein 90 molecular chaperone inhibitor 17-allylamino, 17-demethoxygeldanamycin in human ovarian cancer xenograft models. Clin. Cancer Res. 11:7023–7032 10.1158/1078-0432.CCR-05-0518 - DOI - PubMed
    1. Barrington R.E., Subler M.A., Rands E., Omer C.A., Miller P.J., Hundley J.E., Koester S.K., Troyer D.A., Bearss D.J., Conner M.W., et al. 1998. A farnesyltransferase inhibitor induces tumor regression in transgenic mice harboring multiple oncogenic mutations by mediating alterations in both cell cycle control and apoptosis. Mol. Cell. Biol. 18:85–92 - PMC - PubMed
    1. Basso A.D., Solit D.B., Chiosis G., Giri B., Tsichlis P., Rosen N. 2002. Akt forms an intracellular complex with heat shock protein 90 (Hsp90) and Cdc37 and is destabilized by inhibitors of Hsp90 function. J. Biol. Chem. 277:39858–39866 10.1074/jbc.M206322200 - DOI - PubMed

Publication types

MeSH terms