. 2012 Mar;241(3):465-80.
doi: 10.1002/dvdy.23736. Epub 2012 Jan 23.

Scanning thin-sheet laser imaging microscopy elucidates details on mouse ear development

Affiliations

Scanning thin-sheet laser imaging microscopy elucidates details on mouse ear development

Benjamin Kopecky et al. Dev Dyn. 2012 Mar.

Erratum in

  • Dev Dyn. 2013 May;242(5):591-2

Abstract

Background: The mammalian inner ear is transformed from a flat placode into a three-dimensional (3D) structure with six sensory epithelia that allow for the perception of sound and both linear and angular acceleration. While hearing and balance problems are typically considered to be adult onset diseases, they may arise as a developmental perturbation to the developing ear. Future prevention of hearing or balance loss requires an understanding of how closely genetic mutations in model organisms reflect the human case, necessitating an objective multidimensional comparison of mouse ears with human ears that have comparable mutations in the same gene.

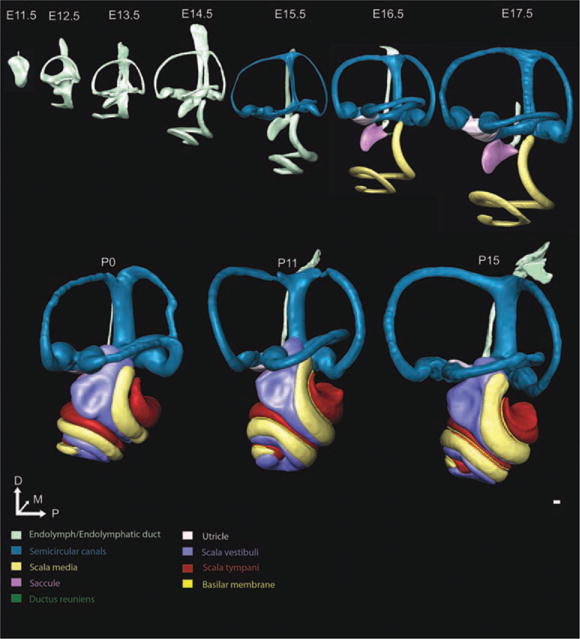
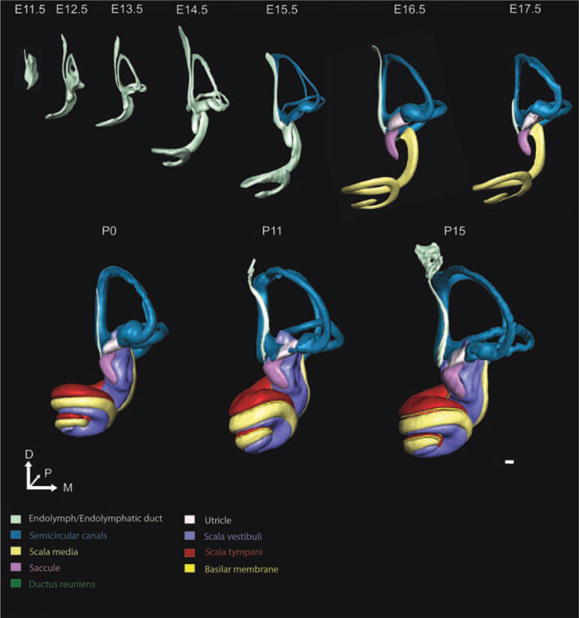
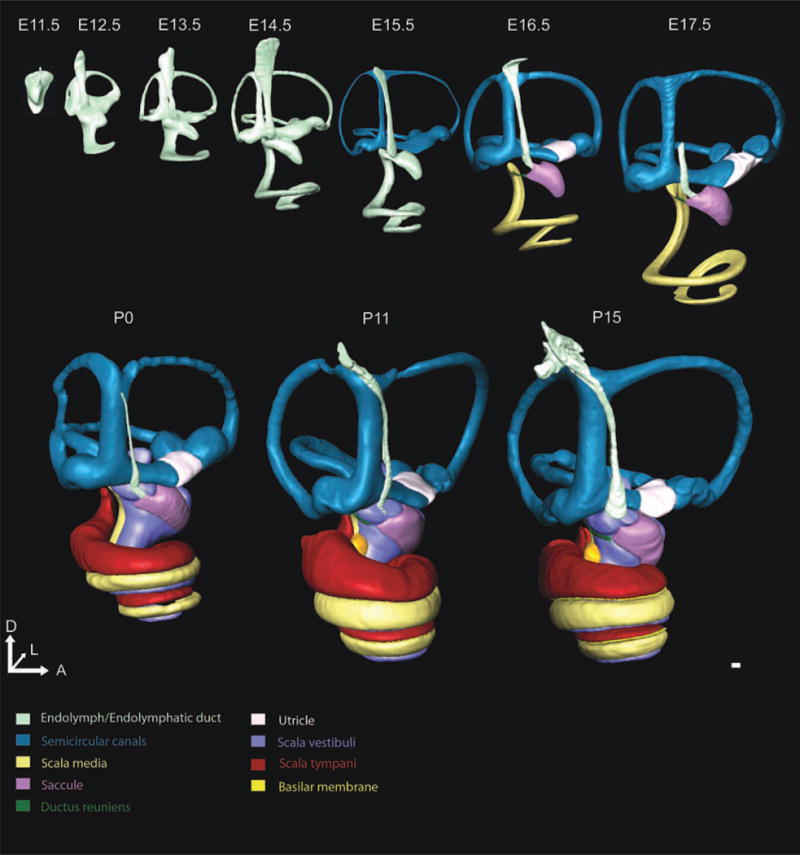
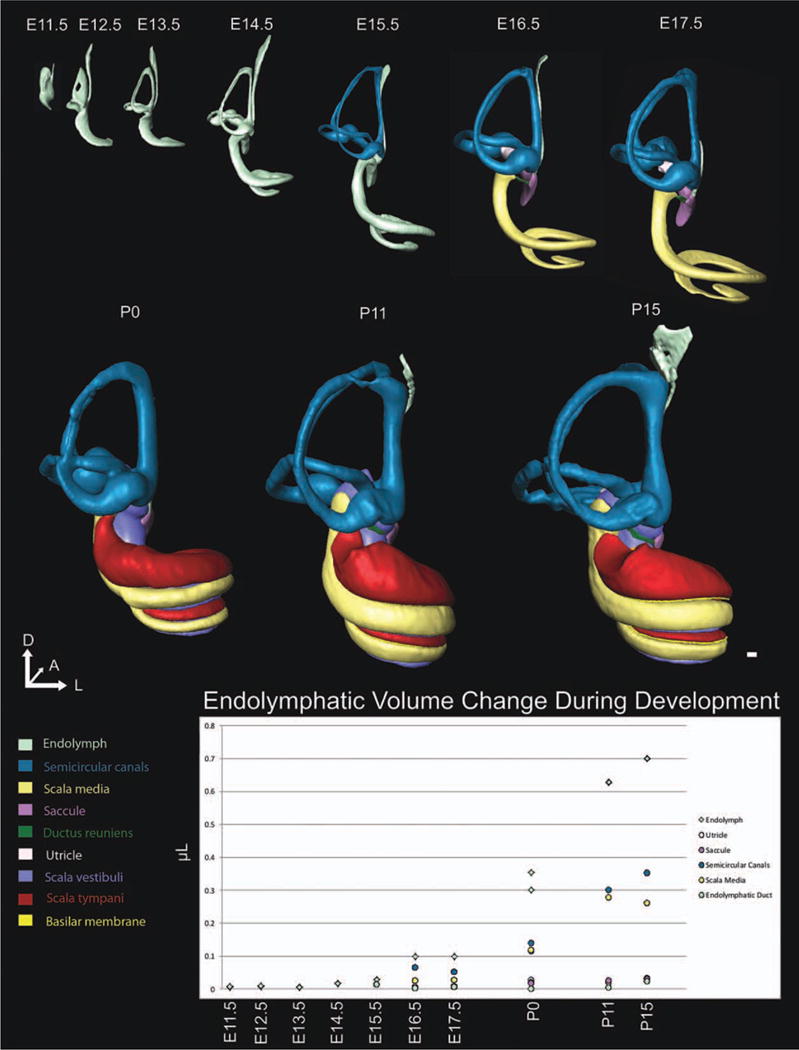
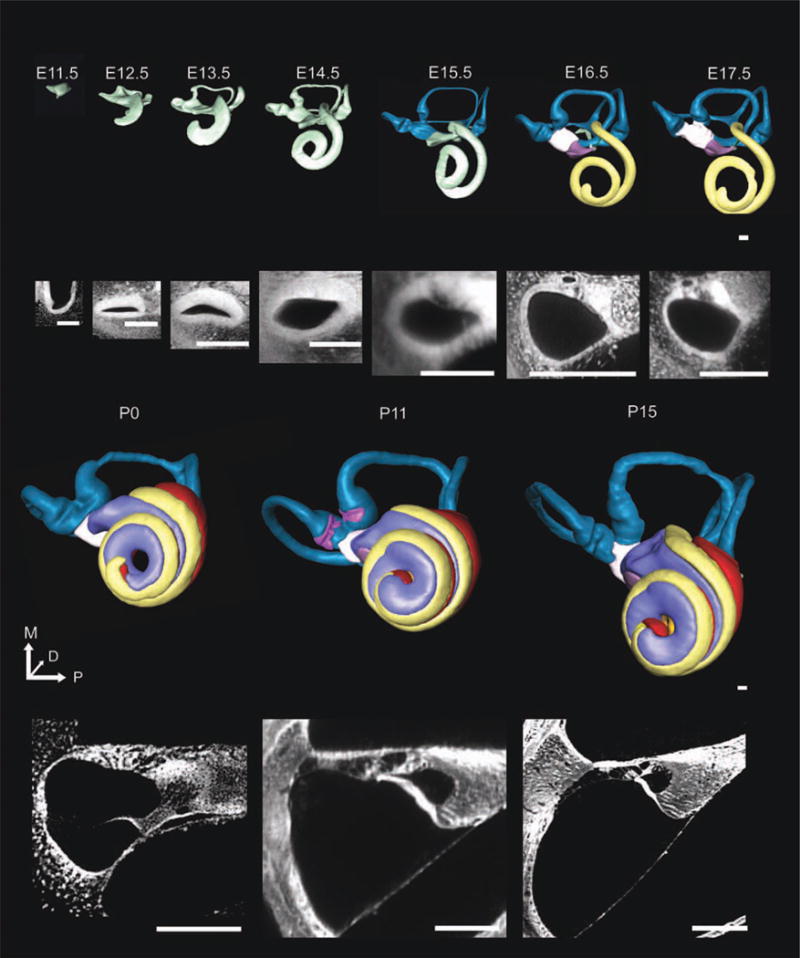
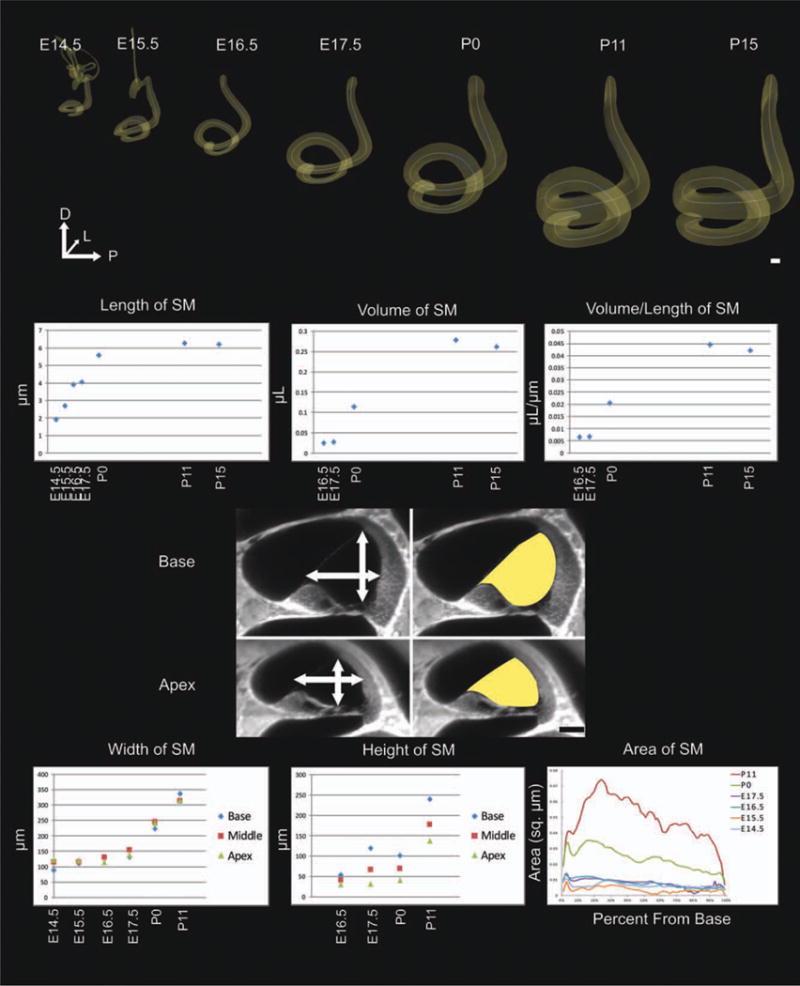
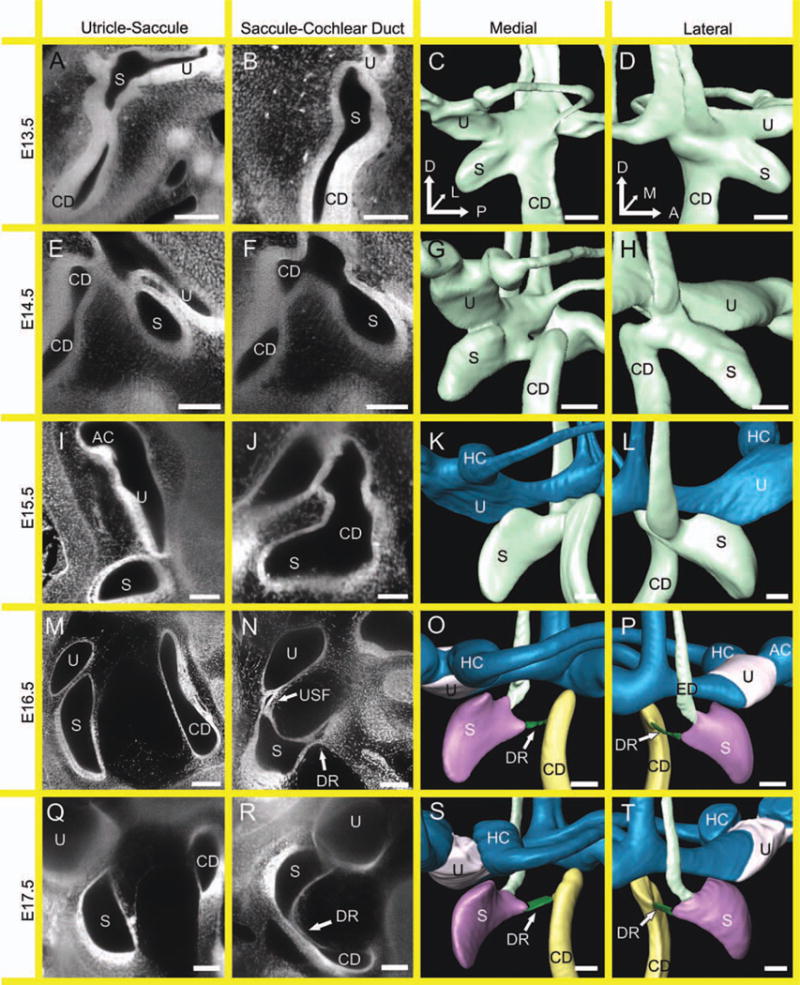
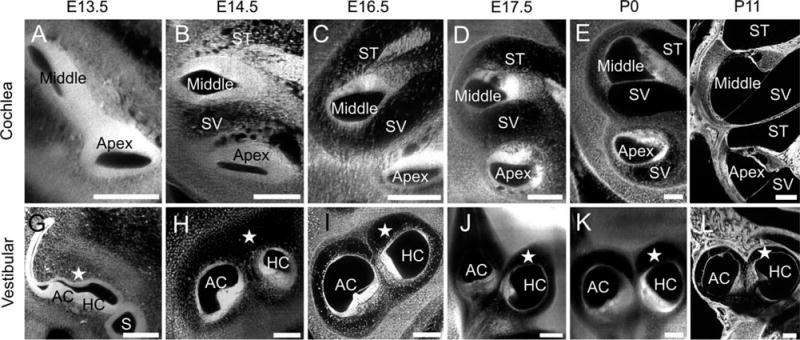
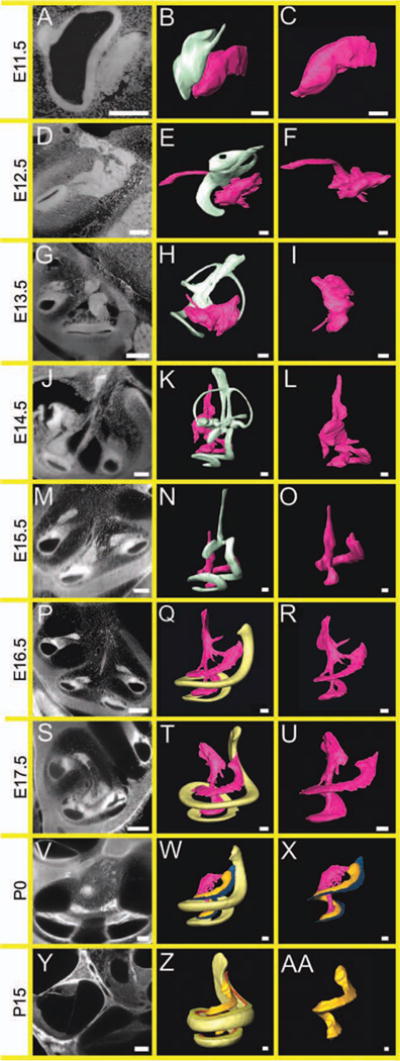
Results: Here, we present improved 3D analyses of normal murine ears during embryonic development using optical sections obtained through Thin-Sheet Laser Imaging Microscopy. We chronicle the transformation of an undifferentiated otic vesicle between mouse embryonic day 11.5 to a fully differentiated inner ear at postnatal day 15.

Conclusions: Our analysis of ear development provides new insights into ear development, enables unique perspectives into the complex development of the ear, and allows for the first full quantification of volumetric and linear aspects of ear growth. Our data provide the framework for future analysis of mutant phenotypes that are currently under-appreciated using only two dimensional renderings.


Figures

Fig. 1
Fig. 1
Lateral view of morphogenesis of inner ear development. Three-dimensional (3D) reconstructions of embryonic day (E) 11.5, E12.5, E13.5, E14.5, E15.5, E16.5, E17.5, postnatal day (P) 0, P11, and P15 mouse inner ears show the shape changes and growth over embryonic and early postnatal development. Once structures are unequivocally defined, we segmented them a different color, with the color-coded chart shown. The ear begins as a small otocyst at E11.5. From E11.5 to E14.5, the ear grows without an increase in endolymphatic fluid as the canal plates resorb into thin canals. At E15.5, the formation of the utriculosaccular foramen almost separates the saccule from the more dorsal vestibular structures. At E16.5, the ductus reuniens allows the identification of the saccule and cochlear duct. In addition, the utricle can be uniquely identified relative to the canal cristae, marking the first age at which all six sensory epithelia are distinct with this technique. While the majority of the morphogenesis appears complete at this time, including near full coiling of the cochlear duct, the inner ear continues to grow and differentiate histologically until P15. The perilymphatic scalae can be identified as early as E14.5; however, they were unable to be segmented until P0 due to incomplete maturation. Structures are shown to scale to appreciate the growth that occurs during development. Scale bar = 100 μm.
Fig. 2
Fig. 2
Anterior view of three-dimensional (3D) development of the ear. The 3D reconstructions of embryonic day (E)11.5, E12.5, E13.5, E14.5, E15.5, E16.5, E17.5, postnatal day (P) 0, P11, and P15 mouse inner ears show the morphogenesis and growth over embryonic and early postnatal development. We have rotated the ears, initially seen in Figure 1, to enable visualization of ear development from the anterior perspective. While overall change over time is the same as shown in Figure 1, the anterior perspective enables understanding of the dramatic change in the ventral portion of the inner ear as the cochlea extends medially and coils initially toward the anterior pole, seen most clearly at E12.5 and E13.5. This perspective, furthermore, enables illustrating the development of the canals and anterior canal crista. The endolymphatic duct is also prominent as a structure anterior and medial to the common crus. It is now easy to see the saccule extending anteriomedioventrally from the middle portion of the ear. From E13.5 to E16.5, the saccule develops a slight curvature which ultimately forms around the scala vestibuli by P0. Structures are shown to scale to appreciate the growth that occurs during development. Scale bar = 100 μm.
Fig. 3
Fig. 3
Medial view of three-dimensional (3D) development of the ear. The 3D reconstructions of embryonic day (E)11.5, E12.5, E13.5, E14.5, E15.5, E16.5, E17.5, postnatal day (P) 0, P11, and P15 mouse inner ears show the morphogenesis and growth over embryonic and early postnatal development. We have rotated the ears to enable visualization of ear development from the medial perspective. While overall change is the same as shown in Figure 1, the medial perspective enables understanding of the dramatic changes in the endolymphatic duct, cochlea, and utricle. At E12.5, the endolymphatic duct is mostly uniform in width; however, by E13.5 and prominently by E14.5, a wide dorsal endolymphatic sac and narrow ventral endolymphatic duct are evident. Note that the endolymphatic duct narrows substantially at E17.5 such that it could no longer be consistently identified. Furthermore, the cochlear duct initially extends laterally at E11.5, coils anteriorly at E12.5, and then medially by E13.5. Lastly, the utricular development is obvious from the medial view as the utricle (shown in white) is not uniquely identifiable until E16.5. Structures are shown to scale to appreciate the growth that occurs during development. Scale bar = 100 μm.
Fig. 4
Fig. 4
Posterior view of three-dimensional (3D) development of the ear. The 3D reconstructions of embryonic day (E)11.5, E12.5, E13.5, E14.5, E15.5, E16.5, E17.5, postnatal day (P) 0, P11, and P15 mouse inner ears show the morphogenesis and growth over embryonic and early postnatal development. We have rotated the ears, to enable visualization of ear development from the posterior perspective. While overall change is the same as shown in Figure 1, the posterior perspective enables understanding of the dramatic change in the ventral portion of the inner ear as the cochlea extends medially and coils initially toward the anterior pole. This perspective enables the ability to illustrate the development of the canals and posterior canal crista. At E12.5 the vertical canal plate has only begun its resorption process; however, by E13.5 this process is nearly complete. Also note the difficulty in identifying the endolymphatic duct, saccule, and utricle as these structures are anteriorly defined. Structures are shown to scale to appreciate the growth that occurs during development. After segmentation is complete, Amira is able to calculate the volume of each 3D rendering. However, until E15.5, only overall endolymphatic fluid was measureable. While there is obvious overall growth of the ear between E11.5 and E15.5 (Fig. 1), there is only a slight increase in endolymphatic volume, likely due to the fact that at E11.5 a single, large otocyst exists but in the next few days this large lumen is subdivided into unique recesses, keeping overall lumen space constant despite the overall increase in size. However, upon definition of all unique recesses by E16.5, a considerable and consistent increase in endolymphatic volume is observed. Note that x-axis is not to scale and fluid volume from E11.5, E12.5, E13.5, E14.5, E16.5, and P0 are means of two littermate ears. Scale bar = 100 μm.
Fig. 5
Fig. 5
Growth and elongation of the forming cochlea. Three-dimensional (3D) reconstructions and 2D optical sections of the developing ear are shown together in Figure 5. The ventral view shows that the tightly coiled cochlear duct emerges as a small protrusion of the ventral tip of the polarized otocyst at embryonic day (E)11.5. The presumptive scala media extends to a half turn at E12.5, three-quarters of a turn by E13.5, one and a half turns by E14.5, one and three-quarters turns by E15.5. At E16.5, the cochlear duct is now distinct from the saccule. By postnatal day (P) 0, all three scalae are observed with little additional maturation after this point. The 3D development is simultaneous with the development of the undifferentiated cochlear duct into the organ of Corti. Between E11.5 and E13.5, the cochlear duct appears to have a thicker boundary of undifferentiated cells on the neural side while having a thinner border of cells on the abneural side (2D sections are below representative 3D image). At E15.5, the middle portion of the thicker side as seen on cross-section begins to develop the organ of Corti as seen by the increasing transparency of the differentiating cells. At P0, the tectorial membrane, three scalae, and organ of Corti can be seen. P11 and P15 images show a mature organ of Corti. The 3D image scale bar = 100 μm. Scale bar for E11.5 2D = 20 μm; remainder of 2D = 100 μm.
Fig. 6
Fig. 6
Growth of the cochlear duct. Beginning at embryonic day (E) 16.5 with the formation of the ductus reuniens, volume measurements can be obtained from the 3D renderings of the growing cochlear duct. Starting with the secondary growth extension of the base of the cochlear duct, length measurements can be accurately determined by creating B-Spline curve fits through the center of the cochlear duct from base to apex. Both the volume and length increase until at least postnatal day (P) 15, but they increase most significantly from E14.5 to P0. Additionally, the volume of the cochlear duct grows with delay compared with the length as shown by the volume to length ratio. From E14.5 to P11, there was a gradual increase in cochlear duct width proportional in the base, middle turn, and apex; however, the height of the base increased more than the middle turn and significantly more than the apex. This differential height increase resulted in a decreased cross-sectional area, starting at P0, in the apex. Scale bar = 100 μm.
Fig. 7
Fig. 7
Development of the saccule and utricle are defined by nonsensory constrictions. Two-dimensional (2D) optical sections and 3D renderings show that the saccule and utricle are formed through the development of the nonsensory constrictions of the utriculosaccular foramen and ductus reuniens. These separate the utricle, the saccule, and the cochlea. Furthermore, the utricular macula must also become distinct from the anterior and horizontal canal cristae. A,B: At embryonic day (E) 13.5, the utricle cannot be distinguished from the saccule (A), nor can the saccule be distinguished from the cochlear duct (B). C,D: As such, despite their 3D appearances of distinct recesses, the actual sensory epithelia are far from distinct. E: At E14.5, the space between the utricle and saccule is narrowing, yet the epithelia are still indistinguishable. F: The same is true for the saccule and cochlear duct. G: However, there is apparent thinning between the utricle, saccule, and cochlea seen from the medial perspective. H: The thinning between the saccule and cochlear duct is also seen from the lateral perspective. I: At E15.5, the utricle is distinguishable from the saccule through the formation of the utriculosaccular foramen. However, even at this stage the utricular macula is indistinguishable from the horizontal cristae without the use of molecular markers (I). J: Despite the formation of the utriculosaccular foramen, the ductus reuniens has yet to form. K,L: The change in color of the vestibular apparatus signifies the formation of the utriculosaccular foramen and the separation of the utricle/semicircular canals from the saccule. M,N: At E16.5, the utricle, saccule, and cochlear duct are all distinct (M) with the formation of the utriculosaccular foramen and ductus reuniens (N). Furthermore, the utricular macula can be identified distinct from the canal cristae. O,P: Therefore, E16.5 marks the first time point where all six sensory epithelia in the inner ear can be identified without the aid of molecular markers. Q–T: The E17.5 marks additional separation of the utricle, saccule, and cochlear duct and the maturation of the utriculosaccular foramen and ductus reuniens. CD, cochlear duct; S, Saccule; U, utricle; AC, anterior crista; HC, horizontal crista; ED, endolymphatic duct; DR, ductus reuniens; USF, utriculosaccular foramen. Scale bar = 100 μm.
Fig. 8
Fig. 8
Development of perilymphatic space is similar in auditory and in vestibular systems. Two-dimensional (2D) optical sections of the ear show that the ventral portion of the inner ear consists of the endolymph-filled cochlear duct. Eventually, this endolymphatic cochlear duct will be defined as the scala media as both a scala vestibuli and scala tympani form perilymphatic spaces on either side. A: We notice that at E13.5, the cochlear duct is well-defined; however, the future scalae vestibuli and tympani cannot be seen. B: A day later, the perilymphatic spaces begin to form, yet, they remain highly immature for the next few days, consisting of many small spaces bound by fibrous tissue, and have no defined boundary. C: By E16.5, the scalae near the middle of the cochlea can be demarcated, however they are still mostly immature and consist of fibrous material throughout; at the same age, the scalae in the apex of the cochlea appear much less mature, are still quite densely filled, and cannot be demarcated. D,E: At E17.5 (D) and P0 (E), the middle turn scalae are well-defined; however, the slower maturing apical scalae are incompletely formed. Nonetheless, they are well-enough-defined at this point that the entire scalae can be segmented for the first time at P0. F: By P11, the scalae throughout the cochlea are fully mature. Of interest, this maturation of perilymphatic space in the cochlea neatly mirrors the same maturation of perilymphatic space in the vestibular system. For ease of description we restrict our images to the spaces around the anterior and horizontal canal cristae. G: At E13.5, only endolymphatic space can be seen with no obvious signs of the future perilymph. However, similar to the cochlea, by E14.5, less dense spaces can be seen surrounding the canal cristae. H: While this future perilymphatic space cannot yet be defined, it is clearly noticeable. I: At E16.5, the canal cristae are well-defined with the perilymphatic space nearly completely mature, yet some fibrous strands are noticed, identical to the maturational age in the cochlea. J–L: By E17.5 (J) and P0 (K), the perilymphatic space is nearly mature with no noticeable difference between P0 and P11 (L). *indicates perilymphatic space. ST, scala tympani; SV, scala vestibuli; AC, anterior crista; HC, horizontal crista. Scale bars = 100 μm.
Fig. 9
Fig. 9
Development of innervation to the inner ear. Two-dimensional (2D) optical sections and 3D renderings show that the innervation of the ear connects the ear to the central auditory pathways. A,B: While this innervation is present at E11.5 (A), fibers cannot be traced to the ear (B). D–L: However, with the initiation of cochlear maturation, processes can be traced to the elongating cochlear duct (D–F), with greatest maturation between E13.5 (G–I) and E14.5 (J–L); at which point hair cells have begun to differentiate. M–O: At E14.5 and E15.5, spiral ganglion neurons become distinct in Rosenthal’s canal. P–R: By E16.5, these neurons are in contact with the immature organ of Corti. S–X: Between E17.5 and P0, the density of innervation appears to increase (S–U) and at P0, spiral ganglion cells can be clearly seen, separating “nervous tissue” into Rosenthal’s canal, the modiolus, and radial fibers (V–X). Y,Z,AA: By P15, the neuronal circuitry is mature (Y,Z) as shown by full elongation of Rosenthal’s canal (AA). Left column is 2D cross-section at stated age. Middle column represents neuronal interaction with the developing ear. Right column shows neuronal maturation. Scale bar = 100 μm.

Similar articles

Cited by

References

    1. Appler JM, Goodrich LV. Connecting the ear to the brain: molecular mechanisms of auditory circuit assembly. Prog Neurobiol. 2011;93:488–508. - PMC - PubMed
    1. Berlanga ML, Phan S, Bushong EA, Wu S, Kwon O, Phung BS, Lamont S, Terada M, Tasdizen T, Martone ME, Ellisman MH. Three-dimensional reconstruction of serial mouse brain sections: solution for flattening high-resolution large-scale mosaics. Front Neuroanat. 2011;5:17. - PMC - PubMed
    1. Bever MM, Fekete DM. Atlas of the developing inner ear in zebrafish. Dev Dyn. 2002;223:536–543. - PubMed
    1. Bever MM, Jean YY, Fekete DM. Three-dimensional morphology of inner ear development in Xenopus laevis. Dev Dyn. 2003;227:422–430. - PubMed
    1. Bouchard M, de Caprona D, Busslinger M, Xu P, Fritzsch B. Pax2 and Pax8 cooperate in mouse inner ear morphogenesis and innervation. BMC Dev Biol. 2010;10:89. - PMC - PubMed

Publication types

LinkOut - more resources