

Unified modeling of gene duplication, loss, and coalescence using a locus tree
- PMID: 22271778
- PMCID: PMC3317157
- DOI: 10.1101/gr.123901.111
Unified modeling of gene duplication, loss, and coalescence using a locus tree
Abstract
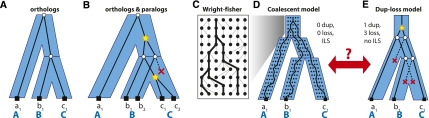
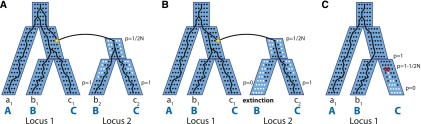
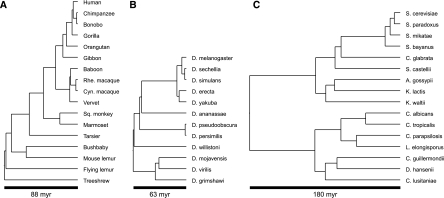
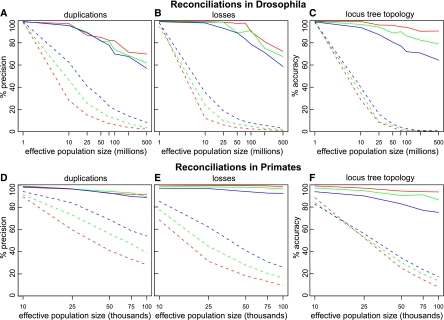
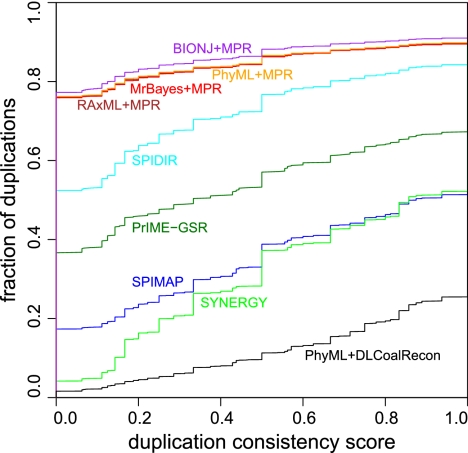
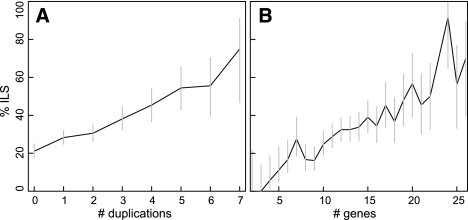
Gene phylogenies provide a rich source of information about the way evolution shapes genomes, populations, and phenotypes. In addition to substitutions, evolutionary events such as gene duplication and loss (as well as horizontal transfer) play a major role in gene evolution, and many phylogenetic models have been developed in order to reconstruct and study these events. However, these models typically make the simplifying assumption that population-related effects such as incomplete lineage sorting (ILS) are negligible. While this assumption may have been reasonable in some settings, it has become increasingly problematic as increased genome sequencing has led to denser phylogenies, where effects such as ILS are more prominent. To address this challenge, we present a new probabilistic model, DLCoal, that defines gene duplication and loss in a population setting, such that coalescence and ILS can be directly addressed. Interestingly, this model implies that in addition to the usual gene tree and species tree, there exists a third tree, the locus tree, which will likely have many applications. Using this model, we develop the first general reconciliation method that accurately infers gene duplications and losses in the presence of ILS, and we show its improved inference of orthologs, paralogs, duplications, and losses for a variety of clades, including flies, fungi, and primates. Also, our simulations show that gene duplications increase the frequency of ILS, further illustrating the importance of a joint model. Going forward, we believe that this unified model can offer insights to questions in both phylogenetics and population genetics.
Figures

Similar articles
-
Most parsimonious reconciliation in the presence of gene duplication, loss, and deep coalescence using labeled coalescent trees.Genome Res. 2014 Mar;24(3):475-86. doi: 10.1101/gr.161968.113. Epub 2013 Dec 5. Genome Res. 2014. PMID: 24310000 Free PMC article.
-
Efficient error correction algorithms for gene tree reconciliation based on duplication, duplication and loss, and deep coalescence.BMC Bioinformatics. 2012 Jun 25;13 Suppl 10(Suppl 10):S11. doi: 10.1186/1471-2105-13-S10-S11. BMC Bioinformatics. 2012. PMID: 22759416 Free PMC article.
-
Reconciliation feasibility in the presence of gene duplication, loss, and coalescence with multiple individuals per species.BMC Bioinformatics. 2017 Jun 5;18(1):292. doi: 10.1186/s12859-017-1701-1. BMC Bioinformatics. 2017. PMID: 28583091 Free PMC article.
-
Models, algorithms and programs for phylogeny reconciliation.Brief Bioinform. 2011 Sep;12(5):392-400. doi: 10.1093/bib/bbr045. Brief Bioinform. 2011. PMID: 21949266 Review.
-
New Approaches for Inferring Phylogenies in the Presence of Paralogs.Trends Genet. 2021 Feb;37(2):174-187. doi: 10.1016/j.tig.2020.08.012. Epub 2020 Sep 10. Trends Genet. 2021. PMID: 32921510 Review.
Cited by
-
Phylogenetic reconciliation.PLoS Comput Biol. 2022 Nov 3;18(11):e1010621. doi: 10.1371/journal.pcbi.1010621. eCollection 2022 Nov. PLoS Comput Biol. 2022. PMID: 36327227 Free PMC article. No abstract available.
-
Para-allopatry in hybridizing fire-bellied toads (Bombina bombina and B. variegata): Inference from transcriptome-wide coalescence analyses.Evolution. 2016 Aug;70(8):1803-18. doi: 10.1111/evo.12978. Epub 2016 Jul 8. Evolution. 2016. PMID: 27282112 Free PMC article.
-
SpeciesRax: A Tool for Maximum Likelihood Species Tree Inference from Gene Family Trees under Duplication, Transfer, and Loss.Mol Biol Evol. 2022 Feb 3;39(2):msab365. doi: 10.1093/molbev/msab365. Mol Biol Evol. 2022. PMID: 35021210 Free PMC article.
-
Efficient Gene Tree Correction Guided by Genome Evolution.PLoS One. 2016 Aug 11;11(8):e0159559. doi: 10.1371/journal.pone.0159559. eCollection 2016. PLoS One. 2016. PMID: 27513924 Free PMC article.
-
Novel Genomic and Evolutionary Perspective of Cyanobacterial tRNAs.Front Genet. 2017 Dec 13;8:200. doi: 10.3389/fgene.2017.00200. eCollection 2017. Front Genet. 2017. PMID: 29321793 Free PMC article.
References
-
- Arvestad L, Berglund A-C, Lagergren J, Sennblad B 2003. Bayesian gene/species tree reconciliation and orthology analysis using MCMC. Bioinformatics 19: i7–i15 - PubMed
-
- Arvestad L, Berglund A, Lagergren J, Sennblad B 2004. Gene tree reconstruction and orthology analysis based on an integrated model for duplications and sequence evolution. In Proceedings of the Eighth Annual International Conference on Computational Molecular Biology (ed. PE Bourne), pp. 326–335. doi: 10.1145/974614.974657. ACM, New York
-
- Arvestad L, Lagergren J, Sennblad B 2009. The gene evolution model and computing its associated probabilities. J ACM 56: 1–44
-
- Avise JC, Robinson TJ 2008. Hemiplasy: A new term in the lexicon of phylogenetics. Syst Biol 57: 503–507 - PubMed
Publication types
MeSH terms
Grants and funding
LinkOut - more resources
Full Text Sources