. 2012 Apr 1;590(7):1563-84.
doi: 10.1113/jphysiol.2011.223271. Epub 2012 Jan 23.

Changes in correlation between spontaneous activity of dorsal horn neurones lead to differential recruitment of inhibitory pathways in the cat spinal cord

Affiliations

Changes in correlation between spontaneous activity of dorsal horn neurones lead to differential recruitment of inhibitory pathways in the cat spinal cord

D Chávez et al. J Physiol. .

Abstract

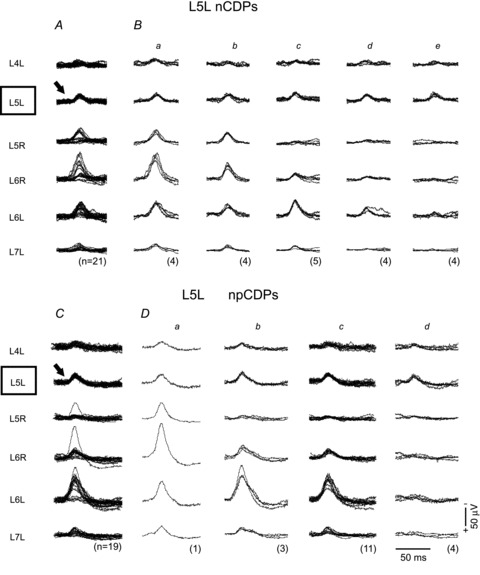
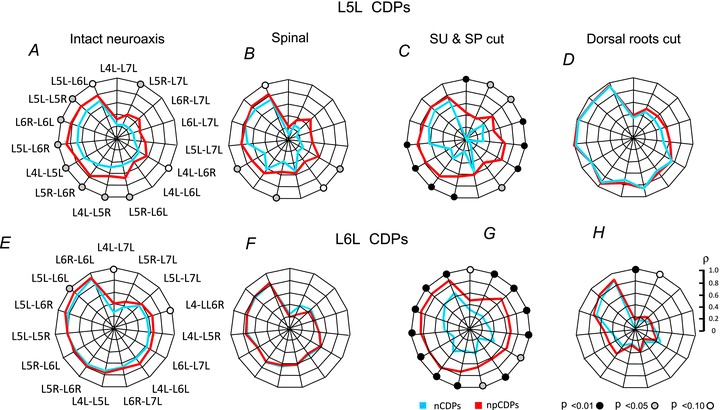
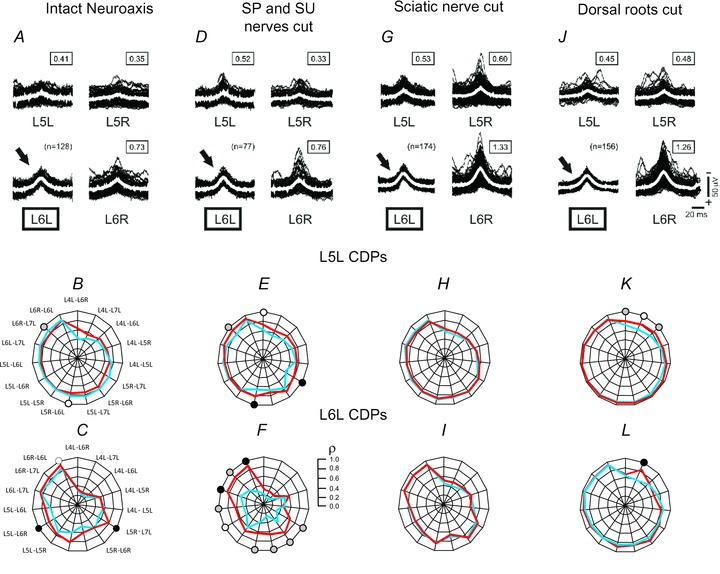
Simultaneous recordings of cord dorsum potentials along the lumbo-sacral spinal cord of the anaesthetized cat revealed the occurrence of spontaneous synchronous negative (n) and negative-positive (np) cord dorsum potentials (CDPs). The npCDPs, unlike the nCDPs, appeared preferentially associated with spontaneous negative dorsal root potentials (DRPs) resulting from primary afferent depolarization. Spontaneous npCDPs recorded in preparations with intact neuroaxis or after spinalization often showed a higher correlation than the nCDPs recorded from the same pair of segments. The acute section of the sural and superficial peroneal nerves further increased the correlation between paired sets of npCDPs and reduced the correlation between the nCDPs recorded from the same pair of segments. It is concluded that the spontaneous nCDPs and npCDPs are produced by the activation of interconnected sets of dorsal horn neurones located in Rexed's laminae III–IV and bilaterally distributed along the lumbo-sacral spinal cord. Under conditions of low synchronization in the activity of this network of neurones there would be a preferential activation of the intermediate nucleus interneurones mediating Ib non-reciprocal postsynaptic inhibition. Increased synchronization in the spontaneous activity of this ensemble of dorsal horn neurones would recruit the interneurones mediating primary afferent depolarization and presynaptic inhibition and, at the same time, reduce the activation of pathways mediating Ib postsynaptic inhibition. Central control of the synchronization in the spontaneous activity of dorsal horn neurones and its modulation by cutaneous inputs is envisaged as an effective mechanism for the selection of alternative inhibitory pathways during the execution of specific motor or sensory tasks.


Figures

Figure 1
Figure 1. Diagram of the method
A, six ball electrodes were placed on the cord dorsum, four on the left side on lumbar segments L4–L7 and two on the right side in segments L5 and L6, as indicated. Traces show the spontaneous cord dorsum potentials recorded from these segments. Ba and b, two sets of spontaneous CDPs simultaneously recorded in different spinal segments selected using as reference the L5L nCDPs (indicated by arrows). Template selection range (±30% of mean) is shown by dotted traces above and below the L5L CDPs. C, coefficients of correlation between the L5L reference nCDPs and the associated L6L CDPs, calculated for different 10 ms time windows. D, superposed L5L and L6L CDPs and their means (white traces). E, median and standard errors of coefficients of correlation between the L5L and L6L CDPs obtained from 22 sets of potentials similar to those illustrated in Ba and Bb. Note that the coefficients of correlation increase during the CDPs. Shaded bar in D and E set at the time of the peak of the CDPs. In all figures negativity is upwards for the CDPs. See text for further details.
Figure 5
Figure 5. Intraspinal distribution of field potentials associated with spontaneous nCDPs and npCDPs
A, mean CDPs and intraspinal field potentials (IFPs) produced by electrical stimulation of the SP nerve with single pulses of 1.3T applied once every second. IFPs were recorded at different depths in a single electrode track (marked with asterisk in D). Means of the simultaneously recorded SP-CDPs have been superposed (upper set of traces). B, intraspinal distribution of spontaneous IFPs associated with reference L6L nCDPs; same microelectrode track as in A. Upper traces show the means of the reference L6L nCDPs used for IFP selection, one for each recording depth. C, same as B, but for IFPs associated with spontaneous L6L npCDPs. D, contour maps of SP evoked responses obtained using data collected from 4 microelectrode tracks (see arrows in D) superposed on drawing obtained from histology. E, contour maps of nIFPS (associated with nCDPs). F, contour maps obtained from npIFPS (associated with npCDPs). Voltage measurements made at time of maximal negativity of the CDPs (indicated by vertical lines in A, B and C). Negativity down for IFPs in AC. In the contour maps of DF, potentials were plotted as a percentage of the maximal amplitude of the negative components (see insert). Further explanations in text.
Figure 2
Figure 2. Spontaneous CDPs selected using reference potentials from different spinal segments
AD, spontaneous nCDPs recorded in a given segment were selected by means of a predetermined template and used as reference (shown by arrows) to display the potentials occurring at the same time in other segments (associated CDPs), as indicated. This procedure displayed synchronized potentials in the left as well as in the right sides of the spinal cord. Each panel shows superposed traces and means (white traces). The boxes on the right side of each set of recordings show the coupling ratios obtained by dividing the mean peak amplitude of the associated CDPs by the mean peak amplitude of the reference nCDPs (their segmental location is marked with a circle). Number of samples is indicated in parentheses. Further explanations in text.
Figure 3
Figure 3. Segmental patterns of spontaneous CDPs
A, spontaneous CDPs recorded from different spinal segments occurring in association with the L5L nCDPs (see arrow). Bae, CDPs displayed in A separated according to their patterns of segmental distribution. C and D, as A and B, for potentials retrieved using as reference the L5L npCDPs. Number of samples is indicated in parentheses. Further explanations in text.
Figure 4
Figure 4. Spontaneous DRPs appear preferentially associated with npCDPs
Simultaneous recordings were made from the left L4, L5 and L6 segments in the cord dorsum and from the central end of a small L6 dorsal rootlet in the same side. A, spontaneous CDPs and DRPs retrieved using as reference the L6L nCDPs (see arrow). B, examples of individual L6L nCDPs and associated DRPs displayed in A separated in 3 different groups. Note that the DRPs displayed in panel a show a positive component only. In panels b and c, no DRPs appear associated with nCDPs. Histogram in A shows the median and standard error of the coefficients of correlation between the L6L CDPs and the DRPs calculated using 10 ms time windows (marked with grey bars in A). C and D the same as in A and B, but for CDPs and DRPs retrieved using as reference the L6L npCDPs. Further explanations in text.
Figure 6
Figure 6. Effects of acute spinalization and cutaneous nerve transection on spontaneous nCDPs
Same format as that of Fig. 2. A, recording arrangement. B, intact neuroaxis. Superposed segmental CDPs retrieved using as reference the L6L nCDPs and their means (see arrow). C, recordings taken 20 min after acute spinalization at low thoracic level (T10). D, spontaneous nCDPs recorded 2 h after spinalization and 20 min after acute transection of the left SU and SP nerves. Numbers in boxes indicate mean peak amplitude ratios of CDPs relative to reference CDPs. Further explanations in text.
Figure 7
Figure 7. Effects of spinalization and deafferentation on the correlation between paired sets of spontaneous nCDPs and npCDPs retrieved using as reference the L5L CDPs
A, preparation with intact neuroaxis. Abscissa, coefficient of correlation (ρ) between paired sets of CDPs retrieved using as reference the L5L nCDPs. Horizontal bars show medians of coefficients arranged in decreasing order and their standard errors. Ordinates show different combinations of CDP recording sites. E, polar graph constructed with the medians of the coefficients of correlation displayed in A. B and F, the same but after acute spinalization. Polar graph shows superposed plots of data obtained from the preparation with intact neuroaxis (black) and of data obtained after spinalization (blue). C and G same after the acute section of the SU and SP nerves. Polar graph shows superposed plots of data obtained from the spinal preparation (blue) and after SU and SP nerve section (red). D and H after bilateral section of dorsal roots. Polar graph shows superposed plots of data obtained after SU and SP nerve section (red) and after dorsal root section (green). IP, same as A–H for data obtained using as reference the L5L npCDPs. All pairs of CDPs are arranged in same order as in A. Correlation calibration scale in P applies to all polar graphs. Black circles indicate statistical significance of differences in correlation between paired sets of CDPs (P < 0.01). Further explanations in text.
Figure 8
Figure 8. Effects of spinalization and deafferentation on correlation between paired sets of spontaneous nCDPs and npCDPs retrieved using as reference the L6L CDPs
Same format and experiment as in Fig. 7 but for CDPs retrieved using as reference the L6L nCDPs and npCDPs. In all cases coefficients of correlation were arranged according to the ranking order of the coefficients displayed in A, Further explanations in text.
Figure 9
Figure 9. Effects of SU and SP nerve section on the intersegmental correlation of spontaneous nCDPs and of npCDPs
Same experiment as that of Figs 6–8. AD, superposed polar graphs of intersegmental correlation between paired sets of CDPs retrieved using as reference the L5L nCDPs (blue) and npCDPs (red). EH, same as A–D for potentials retrieved using as reference the L6L CDPs. Statistical significance of differences between the coefficients of correlation of nCDPs and npCDPs are indicated by circles (P < 0.01, black; P < 0.05, grey; and P < 0.10, white). Further explanations in text.
Figure 10
Figure 10. Effects of graded acute deafferentation on spontaneous CDPs in a preparation with intact neuroaxis
A, CDPs retrieved using as reference L6L nCDPs (see arrow). Neuroaxis and peripheral nerves intact. B and C, superposed polar plots of coefficients of correlation of paired sets of potentials recorded at different locations using as reference the L5L and L6L nCDPs (blue) and npCDPs (red). Coefficients of correlation calculated with data partly shown in A. DF, recordings and polar plots made 20 min after the acute section of the left SP and SU nerves. GI, same after the acute section of the left sciatic nerve made 40 min after the SU and SP nerve section. JL, same after bilateral section of the L4–L7 dorsal roots made 45 min after sectioning the left sciatic nerve. Boxes in A, D, G and J show amplitude ratios of mean peak amplitudes of CDPs relative to peak amplitude of reference CDPs. Number of samples is shown in parentheses. Statistical significance of differences between the coefficients of correlation of nCDPs and npCDPs are indicated by circles (P < 0.01, black; P < 0.05, grey; and P < 0.10, white). Further explanations in text.

Similar articles

Cited by

References

    1. Bannatyne BA, Edgley SA, Hammar I, Jankowska E, Maxwell DJ. Networks of inhibitory and excitatory commissural interneurones mediating crossed reticulospinal actions. Eur J Neurosci. 2003;18:2273–2284. - PMC - PubMed
    1. Beloozerova IN, Rossignol S. Antidromic discharges in dorsal roots of decerebrate cats. II: Studies during treadmill locomotion. Brain Res. 2004;996:227–236. - PubMed
    1. Biella G, Riva L, Sotgiu ML. Interaction between neurones in different laminae of the dorsal horn of the spinal cord. A correlation study in normal and neuropathic rats. Eur J Neurosci. 1997;9:1017–1025. - PubMed
    1. Biella G, Sotgiu ML. Evidence that inhibitory mechanisms mask inappropriate somatotopic connections in the spinal cord of normal rat. J Neurophysiol. 1995;74:495–505. - PubMed
    1. Chu J, Wagle-Shukla A, Gunraj C, Lang AE, Chen R. Impaired presynaptic inhibition in the motor cortex in Parkinson disease. Neurology. 2009;72:842–849. - PubMed

Publication types

LinkOut - more resources