. 2010 Dec;23(4):235-43.
doi: 10.1293/tox.23.235. Epub 2010 Dec 16.

Heat stress in rat adriamycin cardiomyopathy: heat shock protein 25 and Myosin accumulation

Heat stress in rat adriamycin cardiomyopathy: heat shock protein 25 and Myosin accumulation

Mirian Strauss et al. J Toxicol Pathol. 2010 Dec.

Abstract

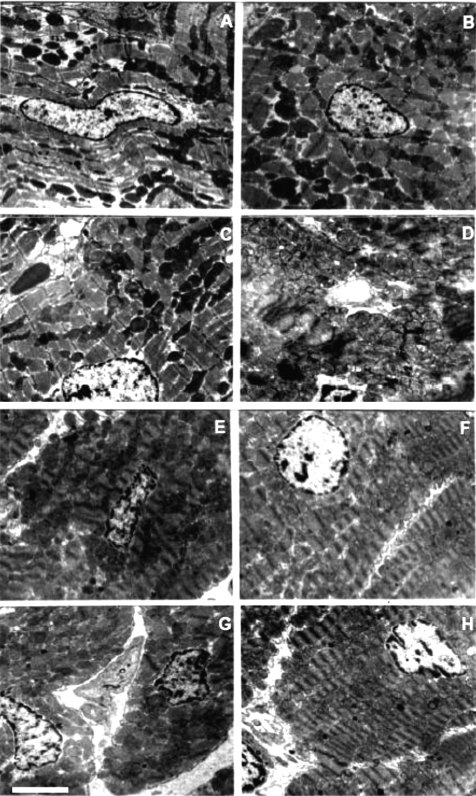
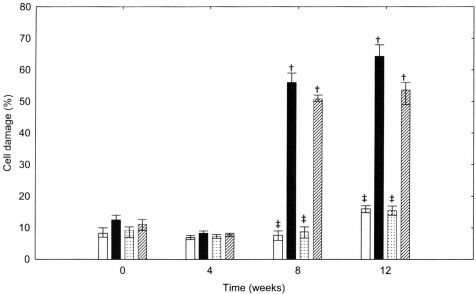
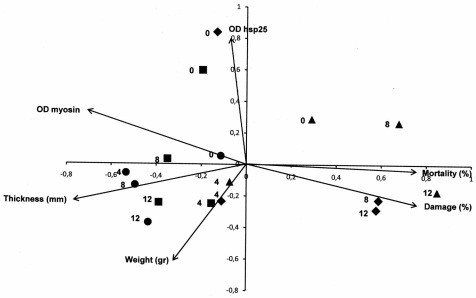
In order to evaluate the effects of hyperthermia on adriamycin cardiomyopathy and its relationship with heat shock protein induction and myosin accumulation, female Sprague-Dawley rats (21-24 days) were randomized into four groups: the control, adriamycin, temperature and temperature-adriamycin groups. Adriamycin was injected i.v. at a dose of 27 mg/Kg (0.1 ml). The rats were exposed to a temperature of 45ºC for 35 min, followed by a recovery (1 h) at room temperature prior to adriamycin treatment. Body weight was recorded weekly. The thickness of the ventricular wall and percentage of cellular damage were biometrically and ultrastructurally evaluated, respectively. Heat shock protein 25 and myosin accumulation were determined through Western blot analysis. The determinations were carried out monthly until the third month after treatment. At eight and twelve weeks after treatment, the thickness of the ventricular wall seemed to decrease in the adriamycin-treated rats in relation to the other groups. An electron microscopic analysis of the adriamycin group's left ventricular wall samples, showed more sarcomeric changes and loss of myofibrils than the control, temperature and temperature-adriamycin groups. At 24 hours after treatment with adriamycin, higher levels of heat shock protein 25 and myosin were observed (week 0) in the temperature-adriamycin group than in the control and adriamycin groups (4, 8 and 12 weeks). Hyperthermia was confirmed by a multivariate approach to induce heat shock protein 25 and myosin, which would strengthen cardiac-sarcomeric myosin arrangement.

Keywords: adriamycin cardiomyopathy; cellular damage; heat shock protein 25; hyperthermia; left ventricular wall thickness; myosin.


Figures

Fig. 1
Fig. 1
Heat stress and drug administration protocol. The animals were randomized into the followings four groups (n=20 each group): the control (Control), Adriamycin (Adr), Temperature (Temp) and Temperature-Adriamycin (Temp-Adr) groups. The rats of the control group were injected with sterile water (0.1 ml i.v; H2O; arrow). Adriamycin was injected i.v. in three sub-doses of 9 mg/kg body weight/0.1 ml/day (Adr; dashed arrow) applied at 3-day intervals to a cumulative dose of 27 mg/kg body weight. The Temp-Adr group rats were exposed to a temperature of 45ºC for 35 min (HS; arrowhead) prior to adriamycin treatment and allowed to recover at 23ºC for 1 h. At 24 hours after the third adriamycin sub-dose 0, 4, 8 and 12 weeks after treatment, the hearts of the rats were removed (R; downwards arrow) for biometric, ultrastructural and biochemical studies.
Fig. 2
Fig. 2
Cumulative mortality during the experimental period for all groups. An increase in mortality was observed in the Adr group (75%) in contrast to the results of the Control, Temp and Temp-Adr rats, which showed 0, 0 and 30% mortality, respectively. The column corresponds to the mean cumulative mortality, and the whisker corresponds to the standard error. ANOVA and the Duncan post hoc test showed significance differences among groups (p<0.05).
Fig. 3
Fig. 3
Weight gain during the experimental period. Adriamycin caused a significant reduction in body weight from week 4 compared with the Control and Temp groups. The Temp-Adr group experienced a decrease in body weight from week 4 until week 12. The Control, Adr, Temp and Temp-Adr rats are indicated by empty squares, empty diamonds, empty triangles and full circles, respectively. Values are shown as the means ± standard errors. ANOVA and Duncan post hoc test showed significance differences among groups (p<0.05). Statistically significant differences compared with the control and Adr groups are indicated with a dagger and double-dagger, respectively.
Fig. 4
Fig. 4
Left ventricular wall thickness. The wall thickness reduction in the Adr group seems to be bigger than that in the Temp-Adr group at 8 and 12 weeks. The Control, Adr, Temp and Temp-Adr groups are indicated by white columns, black columns, dotted columns and slashed columns, respectively. Values are shown as the means ± standard errors. ANOVA and Duncan post hoc test showed significance differences among groups (p<0.05). Statistically significant differences compared with the control and Adr groups are indicated with a dagger and double-dagger, respectively.
Fig. 5
Fig. 5
Electron photomicrographs of free left wall ventricular cardiac tissue at 0 and 4 weeks after treatment. Cardiac tissue showed normal appearances in all four groups at 0 week (A–D). A small number of sarcomeric and mitochondria alterations and the presence of vacuoles and lipid droplets were observed in the Adr and Temp-Adr samples compared with the Control and Temp samples at 4 weeks (E–H) after treatment. Images A and E, B and F, C and G and D and H are of Control, Adr, Temp and Temp-Adr tissues, respectively (magnification, ×6280; scale bar=2.3 μm; taken with 75 kV).
Fig. 6
Fig. 6
Electron photomicrographs of left ventricular wall cardiac tissue at 8 and 12 weeks after treatment. Myofibrillar disarrangement, abundant intermyofibrillar spaces and disassembly, rupture and loss of myofibrils were observed in the Adr and Temp-Adr samples in contrast to the Control and Temp samples, which had normal patterns of cardiac tissue. The Adr group alterations seemed to be larger than those of the Temp-Adr group both at 8 and 12 weeks after treatment. Images A and E, B and F, C and G and D and H are of Control, Adr, Temp and Temp-Adr tissues, respectively (magnification, ×6280; scale bar=2.3 μm; taken with 75 kV).
Fig. 7
Fig. 7
Cellular damage of left ventricular wall cardiac tissue. The Adr group showed the highest percentage of cellular damage in contrast to the Temp-Adr samples, which had the least cellular damage (8 and 12 weeks). The percentage of cellular damage was interpreted following a semi-quantitative scoring cytogram system. Values ranging from 0–4 were assigned to cellular damage zones for all four groups. The 100% level of damage was related to the maximal theoretical value of 72. The Control, Adr, Temp and Temp-Adr groups are indicated by white columns, black columns, dotted columns and slashed columns, respectively. Values are shown as the means ± standard errors. ANOVA and Duncan post hoc test showed significance differences among groups (p<0.05). Statistically significant differences compared with the control and Adr groups are indicated with a dagger and double-dagger, respectively.
Fig. 8
Fig. 8
Western blot analysis of Hsp25 and myosin accumulation. In the Adr group, two bands were recognized by the anti-Hsp25 antibody at 0 and 8 weeks after treatment. The Temp-Adr group had the densest band recognized by the same antibody (week 0) (A). Consistent which the highest accumulation of Hsp25, myosin also had its densest band in the Temp-Adr-treated group at 0 week. This result was similar to that in the Control group at 4 weeks and to that of the Temp group at week 0. Myosin accumulation decreased more in both Adr-treated groups from week 8 (B). The Western blot analysis is shown above the densitometric analysis. The Control, Adr, Temp and Temp-Adr groups are indicated by white columns, black columns, dotted columns and slashed columns, respectively. Values are shown as means ± standard error. ANOVA and Duncan post hoc test showed significance differences among groups (p<0.05). Statistically significant differences compared with the Control and Adr groups are indicated with a dagger and double-dagger, respectively.
Fig. 9
Fig. 9
Cartesian representation of the Principal Components Analysis. Mortality and cell damage were directly correlated, while Hsp25, left ventricular wall thickness and myosin autovectors pointed in the opposite direction. Mortality and cell damage were antipodal variables for myosin. Each symbol is associated with a number (representing time in weeks) and a letter (symbolizing the groups). The Control, Adr, Temp and Temp-Adr groups are indicated by filled triangles, filled squares, filled circles and filled diamonds, respectively. The arrowed lines correspond to autovectors; each autovector matches with a variable (mortality, body weight, left ventricular wall thickness, cell damage, myosin and Hsp25 accumulation).

Similar articles

Cited by

References

    1. Buzdar A, Marcus C, Smith T, Blumenschein G. Early and delayed clinical cardiotoxicity of doxorubicin. Cancer. 1985;55:2761–2765. - PubMed
    1. Kalivendi S, Kotamraju S, Zhao H, Joseph J, Kalyanaraman B. Doxorubicin-induced apoptosis is associated with increased transcription of endothelial nitric-oxide synthase. Effect of antiapoptoticantioxidants and calcium. J Biol Chem. 2001;276:47266–47276. - PubMed
    1. Strauss M, Anselmi G, Hermoso T, Tejero F. Carnitine promotes heat shock protein synthesis in Adriamycin-induced cardiomyopathy in a neonatal rat experimental model. J Mol Cell Cardiol. 1998;30:2319–2325. - PubMed
    1. Joyeux M, Godin-Ribuot D, Faure P, Demenge P, Ribuot C. Heat stress protects against electrophysiological damages induced by acute doxorubicin exposure in isolated rat hearts. Cardiovasc Drugs Ther. 2001;15:219–224. - PubMed
    1. Ito H, Miller S, Billingham M, Akimoto H, Torti S, Wade R, Gahlmann R, Lyons G, Kedes L, Torti FM. Doxorubicin selectively inhibits muscle gene expression in cardiac muscle cells in vivo and in vitro. Proc Natl Acad Sci USA. 1990;87:4275–4279. - PMC - PubMed