

Evaluation of bone toxicity in various bones of aged rats
- PMID: 22272043
- PMCID: PMC3234621
- DOI: 10.1293/tox.24.41
Evaluation of bone toxicity in various bones of aged rats
Abstract
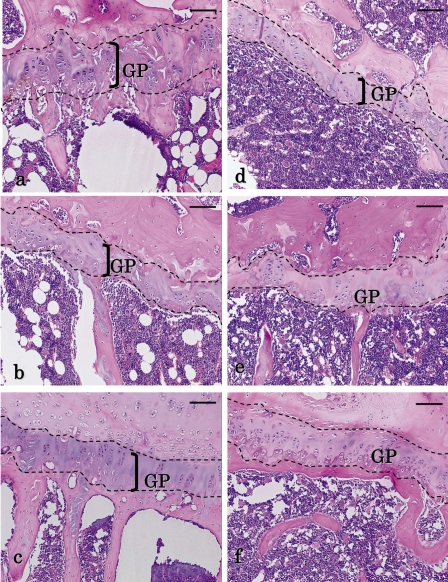
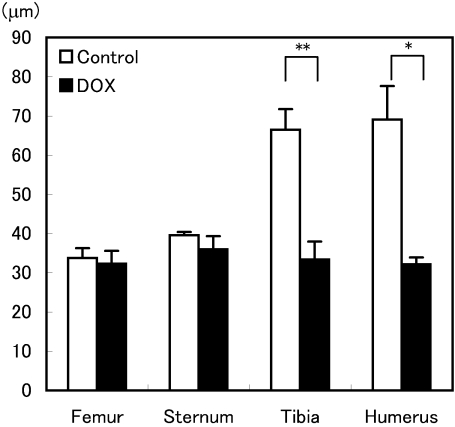
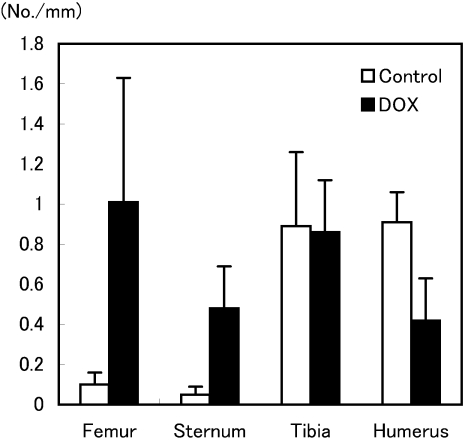
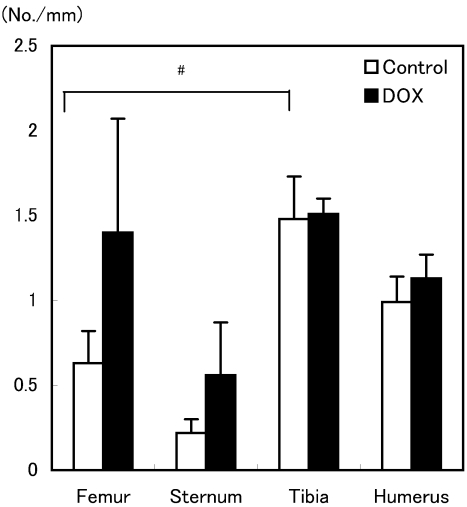
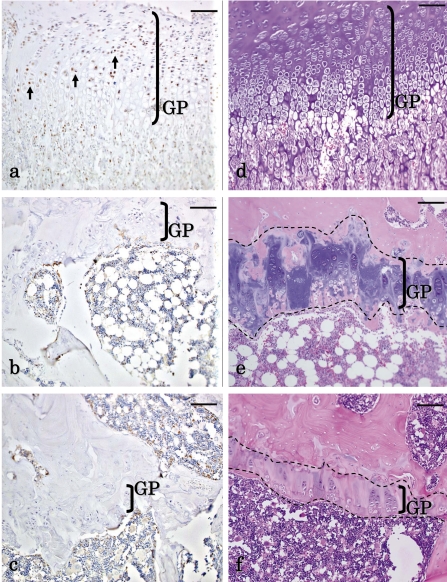
The aim of the present study was to provide a method for evaluating bone toxicity induced by drugs in various bones in aged rats. Male Crl:CD (SD) rats at 46 weeks of age were administered 15 mg/m(2) body surface area of doxorubicin, which effects the growth plate in weanling rats, weekly for 9 weeks by intravenous injection, and the femur, sternum, humerus and tibia were examined histopathologically. In the doxorubicin-treated group, thinning of the growth plate was remarkably observed in the proximal tibia and humerus; however, these changes were not observed in other regions. In addition, the osteoclast number per bone perimeter in the proximal tibia was significantly higher than others in control aged rat. Thus, recognizing the various histological reactions related to the time of epiphyseal closure is important for evaluating bone toxicity in aged rats.
Keywords: bone toxicity; doxorubicin; epiphyseal closure; growth plate; rat.
Figures
Similar articles
-
Epiphyseal lesions of the femur and tibia in rats following oral chronic administration of zinc dimethyldithiocarbamate (ziram).Toxicology. 1989 Jan;54(1):45-58. doi: 10.1016/0300-483x(89)90077-2. Toxicology. 1989. PMID: 2916241
-
Thalidomide affects the skeletal system of young rats.Acta Pol Pharm. 2013 Mar-Apr;70(2):323-31. Acta Pol Pharm. 2013. PMID: 23614289
-
Chemotherapy affects the pattern of failure after shear loading of the proximal tibial growth plate.Arch Orthop Trauma Surg. 2004 Oct;124(8):503-6. doi: 10.1007/s00402-004-0732-z. Epub 2004 Sep 14. Arch Orthop Trauma Surg. 2004. PMID: 15372277
-
Effect of thyroid hormone and growth hormone on recovery from hypothyroidism of epiphyseal growth plate cartilage and its adjacent bone.Endocrinology. 1989 Feb;124(2):937-45. doi: 10.1210/endo-124-2-937. Endocrinology. 1989. PMID: 2912707
-
Retinoid-induced epiphyseal plate closure in guinea pigs.Fundam Appl Toxicol. 1996 Nov;34(1):91-8. doi: 10.1006/faat.1996.0179. Fundam Appl Toxicol. 1996. PMID: 8937896
Cited by
-
Effects of doxorubicin administration on bone strength and quality in sedentary and physically active Wistar rats.Osteoporos Int. 2016 Dec;27(12):3465-3475. doi: 10.1007/s00198-016-3672-x. Epub 2016 Jun 18. Osteoporos Int. 2016. PMID: 27318466
-
Can Denosumab be used in combination with Doxorubicin in Osteosarcoma?Oncotarget. 2020 Jul 14;11(28):2763-2773. doi: 10.18632/oncotarget.27669. eCollection 2020 Jul 14. Oncotarget. 2020. PMID: 32733647 Free PMC article.
-
Nonproliferative and Proliferative Lesions of the Rat and Mouse Skeletal Tissues (Bones, Joints, and Teeth).J Toxicol Pathol. 2016;29(3 Suppl):49S-103S. doi: 10.1293/tox.29.3S-2. Epub 2016 Jul 29. J Toxicol Pathol. 2016. PMID: 27621538 Free PMC article. Review.
References
-
- Young B, Heath JW. Wheather’s Functional Histology a Text and Colour Atlas, 4th ed. Churchill livingstone, Edinburgh. 2000
-
- Leininger JR, Riley MG. Bones, joints, and synovia. In: Pathology of the Fischer Rat. GA Boorman, SL Eustis, MR Elwell, C Montgomery Jr., and WF Mackenzie (eds). Academic press, San diego. 209–226. 1990
-
- Fukuda S, Matsuoka O. Maturation process of secondary ossification centers in the rat and assessment of bone age. Exp Anim. 28: 1–9 1979 - PubMed
-
- Woodard JC, Jee WS. Skeletal system. In: Fundamentals of Toxicologic Pathology. WM Haschek and CG Rousseaux (eds). Academic Press, San Diego. 275–308. 1998
-
- Boss JH, Misselevich I. Osteonecrosis of the femoral head of laboratory animals: the lessons learned from a comparative study of osteonecrosis in man and experimental animals. Vet Pathol. 40: 345–354 2003 - PubMed
LinkOut - more resources
Full Text Sources