

Application of structure equation modeling for inferring a serial transcriptional regulation in yeast
- PMID: 22272062
- PMCID: PMC3236004
- DOI: 10.4137/GRSB.S7569
Application of structure equation modeling for inferring a serial transcriptional regulation in yeast
Abstract
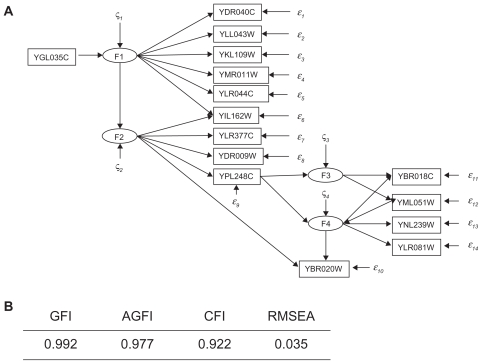
Revealing the gene regulatory systems among DNA and proteins in living cells is one of the central aims of systems biology. In this study, I used Structural Equation Modeling (SEM) in combination with stepwise factor analysis to infer the protein-DNA interactions for gene expression control from only gene expression profiles, in the absence of protein information. I applied my approach to infer the causalities within the well-studied serial transcriptional regulation composed of GAL-related genes in yeast. This allowed me to reveal the hierarchy of serial transcriptional regulation, including previously unclear protein-DNA interactions. The validity of the constructed model was demonstrated by comparing the results with previous reports describing the regulation of the transcription factors. Furthermore, the model revealed combinatory regulation by Gal4p and Gal80p. In this study, the target genes were divided into three types: those regulated by one factor and those controlled by a combination of two factors.
Keywords: Structural equation modeling; expression profile; gene regulatory network; transcriptional regulation.
Figures


Similar articles
-
Multiple metabolic signals influence GAL gene activation by modulating the interaction of Gal80p with the transcriptional activator Gal4p.Mol Microbiol. 2010 Oct;78(2):414-28. doi: 10.1111/j.1365-2958.2010.07343.x. Mol Microbiol. 2010. PMID: 20979343
-
Stochastic analysis of the GAL genetic switch in Saccharomyces cerevisiae: modeling and experiments reveal hierarchy in glucose repression.BMC Syst Biol. 2008 Nov 17;2:97. doi: 10.1186/1752-0509-2-97. BMC Syst Biol. 2008. PMID: 19014615 Free PMC article.
-
Inferring transcriptional compensation interactions in yeast via stepwise structure equation modeling.BMC Bioinformatics. 2008 Mar 3;9:134. doi: 10.1186/1471-2105-9-134. BMC Bioinformatics. 2008. PMID: 18312694 Free PMC article.
-
Transcriptional control of the GAL/MEL regulon of yeast Saccharomyces cerevisiae: mechanism of galactose-mediated signal transduction.Mol Microbiol. 2001 Jun;40(5):1059-66. doi: 10.1046/j.1365-2958.2001.02421.x. Mol Microbiol. 2001. PMID: 11401712 Review.
-
Yeast chromatin structure and regulation of GAL gene expression.Prog Nucleic Acid Res Mol Biol. 2001;65:197-259. doi: 10.1016/s0079-6603(00)65006-7. Prog Nucleic Acid Res Mol Biol. 2001. PMID: 11008489 Review.
Cited by
-
The Wright stuff: reimagining path analysis reveals novel components of the sex determination hierarchy in Drosophila melanogaster.BMC Syst Biol. 2015 Sep 4;9:53. doi: 10.1186/s12918-015-0200-0. BMC Syst Biol. 2015. PMID: 26335107 Free PMC article.
-
Investigating perturbed pathway modules from gene expression data via structural equation models.BMC Bioinformatics. 2014 May 6;15:132. doi: 10.1186/1471-2105-15-132. BMC Bioinformatics. 2014. PMID: 24885496 Free PMC article.
-
Inference of Regulatory System for TAG Biosynthesis in Lipomyces starkeyi.Bioengineering (Basel). 2020 Nov 19;7(4):148. doi: 10.3390/bioengineering7040148. Bioengineering (Basel). 2020. PMID: 33227954 Free PMC article.
-
Systems biology in physiology: the vasopressin signaling network in kidney.Am J Physiol Cell Physiol. 2012 Dec 1;303(11):C1115-24. doi: 10.1152/ajpcell.00270.2012. Epub 2012 Aug 29. Am J Physiol Cell Physiol. 2012. PMID: 22932685 Free PMC article. Review.
-
Network inference of pal-1 lineage-specific regulation in the C. elegans embryo by structural equation modeling.Bioinformation. 2012;8(14):652-7. doi: 10.6026/97320630008652. Epub 2012 Jul 21. Bioinformation. 2012. PMID: 23055605 Free PMC article.
References
-
- Brazhnik P, Fuente A, Mende P. Gene networks: how to put the function in genomics. Trends in Biotechnology. 2002;20(11):467–72. - PubMed
-
- Akutsu T, Miyano S, Kuhara S. Algorithms for identifying Boolean networks and related biological networks based on matrix multiplication and fingerprint function. J Comput Biol. 2000;7:331–43. - PubMed
-
- Friedman N, Linial M, Nachman I, Pe’er D. Using Bayesian networks to analyze expression data. J Comput Biol. 2000;7:601–20. - PubMed
-
- Aburatani S, Kuhara S, Toh H, Horimoto K. Deduction of a gene regulatory relationship framework from gene expression data by the application of graphical Gaussian modeling. Signal Processing. 2003;83:777–88.
-
- Aburatani S, Horimoto K. Elucidation of the Relationships between LexA-Regulated Genes in the SOS response. Genome Informatics. 2005;16:95–105. - PubMed
LinkOut - more resources
Full Text Sources
Molecular Biology Databases
