

Combined pharmacophore modeling, docking, and 3D-QSAR studies of PLK1 inhibitors
- PMID: 22272100
- PMCID: PMC3257097
- DOI: 10.3390/ijms12128713
Combined pharmacophore modeling, docking, and 3D-QSAR studies of PLK1 inhibitors
Abstract
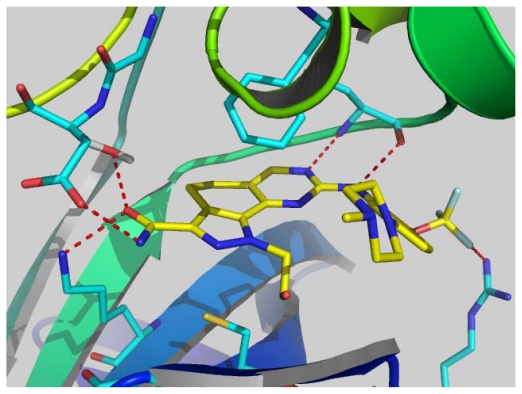
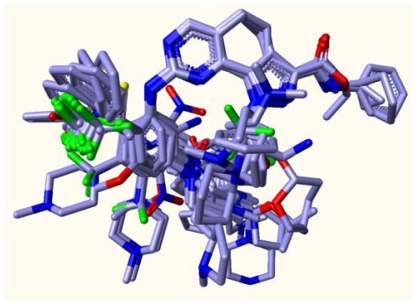
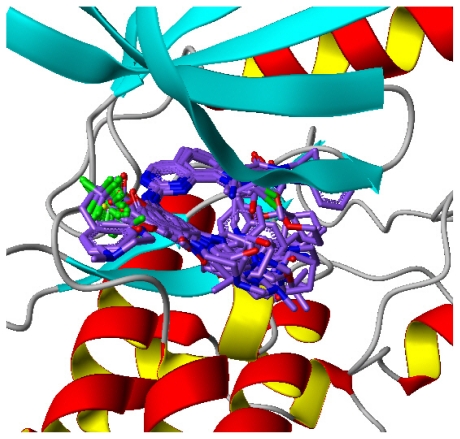
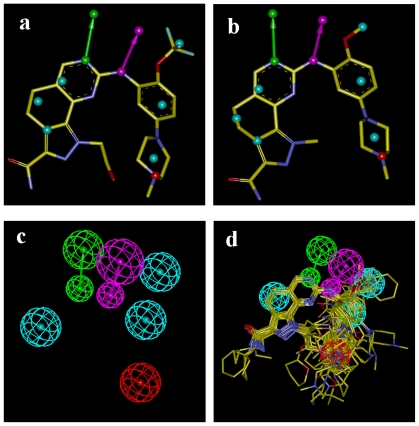
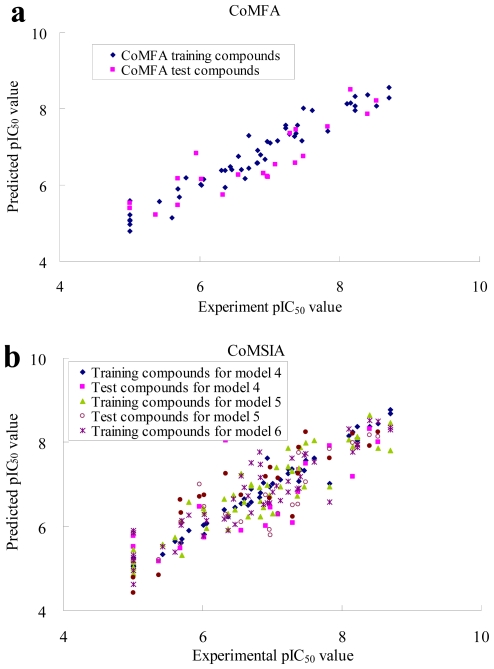
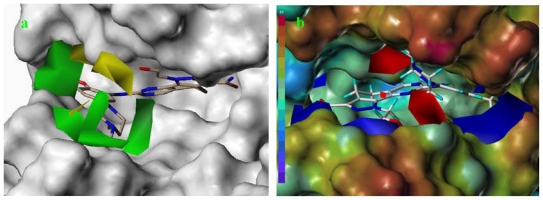
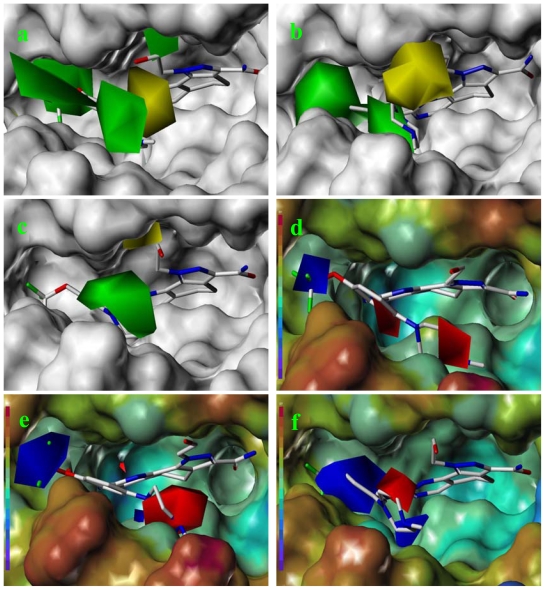
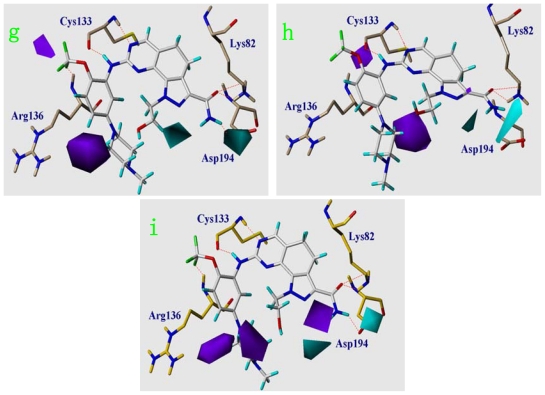
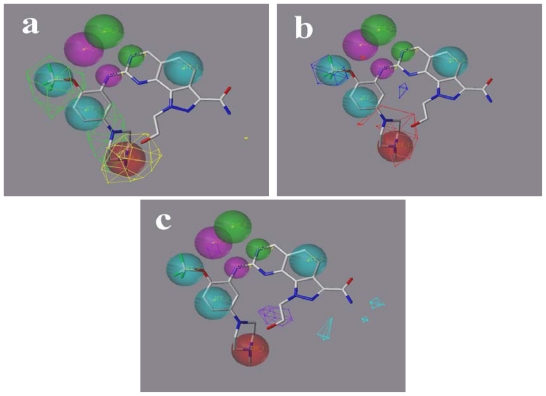
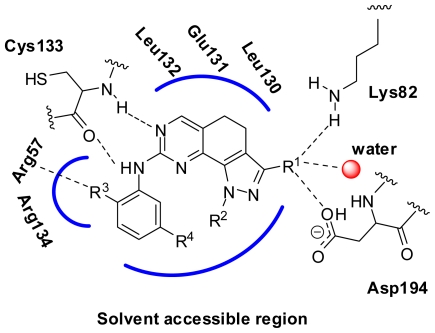
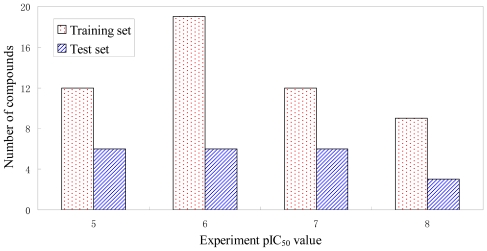
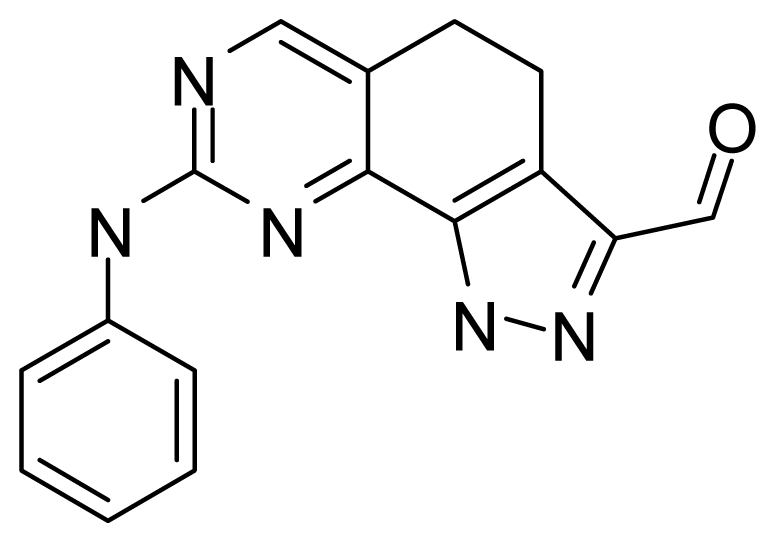
Polo-like kinase 1, an important enzyme with diverse biological actions in cell mitosis, is a promising target for developing novel anticancer drugs. A combined molecular docking, structure-based pharmacophore modeling and three-dimensional quantitative structure-activity relationship (3D-QSAR) study was performed on a set of 4,5-dihydro-1H-pyrazolo[4,3-h]quinazoline derivatives as PLK1 inhibitors. The common substructure, molecular docking and pharmacophore-based alignment were used to develop different 3D-QSAR models. The comparative molecular field analysis (CoMFA) and comparative molecule similarity indices analysis (CoMSIA) models gave statistically significant results. These models showed good q(2) and r(2) (pred) values and revealed a good response to test set validation. All of the structural insights obtained from the 3D-QSAR contour maps are consistent with the available crystal structure of PLK1. The contour maps obtained from the 3D-QSAR models in combination with the structure based pharmacophore model help to better interpret the structure-activity relationship. These satisfactory results may aid the design of novel PLK1 inhibitors. This is the first report on 3D-QSAR study of PLK1 inhibitors.
Keywords: 3D-QSAR; PLK1; molecular docking; pharmacophore.
Figures
Similar articles
-
Ligand-based pharmacophore modeling, atom-based 3D-QSAR and molecular docking studies on substituted thiazoles and thiophenes as polo-like kinase 1 (Plk1) inhibitors.Comb Chem High Throughput Screen. 2014;17(10):848-58. doi: 10.2174/1386207317666141024152910. Comb Chem High Throughput Screen. 2014. PMID: 25346190
-
Design and Synthesis of a Novel PLK1 Inhibitor Scaffold Using a Hybridized 3D-QSAR Model.Int J Mol Sci. 2021 Apr 8;22(8):3865. doi: 10.3390/ijms22083865. Int J Mol Sci. 2021. PMID: 33917995 Free PMC article.
-
Combined 3D-QSAR modeling and molecular docking study on indolinone derivatives as inhibitors of 3-phosphoinositide-dependent protein kinase-1.J Chem Inf Model. 2008 Sep;48(9):1760-72. doi: 10.1021/ci800147v. Epub 2008 Aug 22. J Chem Inf Model. 2008. PMID: 18717540
-
QSAR-guided pharmacophoric modeling reveals important structural requirements for Polo kinase 1 (Plk1) inhibitors.J Mol Graph Model. 2021 Dec;109:108022. doi: 10.1016/j.jmgm.2021.108022. Epub 2021 Sep 18. J Mol Graph Model. 2021. PMID: 34562852
-
Tracking protein kinase targeting advances: integrating QSAR into machine learning for kinase-targeted drug discovery.Future Sci OA. 2025 Dec;11(1):2483631. doi: 10.1080/20565623.2025.2483631. Epub 2025 Apr 4. Future Sci OA. 2025. PMID: 40181786 Free PMC article. Review.
Cited by
-
An enzoinformatics study targeting polo-like kinases-1 enzyme: Comparative assessment of anticancer potential of compounds isolated from leaves of Ageratum houstonianum.Pharmacogn Mag. 2014 Jan;10(Suppl 1):S14-21. doi: 10.4103/0973-1296.127333. Pharmacogn Mag. 2014. PMID: 24914294 Free PMC article.
-
Consensus holistic virtual screening for drug discovery: a novel machine learning model approach.J Cheminform. 2024 May 28;16(1):62. doi: 10.1186/s13321-024-00855-8. J Cheminform. 2024. PMID: 38807196 Free PMC article.
-
Combined structure-based pharmacophore and 3D-QSAR studies on phenylalanine series compounds as TPH1 inhibitors.Int J Mol Sci. 2012;13(5):5348-5363. doi: 10.3390/ijms13055348. Epub 2012 May 2. Int J Mol Sci. 2012. PMID: 22754301 Free PMC article.
-
Potent VEGFR-2 inhibitors for resistant breast cancer: a comprehensive 3D-QSAR, ADMET, molecular docking and MMPBSA calculation on triazolopyrazine derivatives.Front Mol Biosci. 2023 Nov 22;10:1288652. doi: 10.3389/fmolb.2023.1288652. eCollection 2023. Front Mol Biosci. 2023. PMID: 38074087 Free PMC article.
-
Design, Synthesis, Biological Evaluation, and Molecular Modeling of 2-Difluoromethylbenzimidazole Derivatives as Potential PI3Kα Inhibitors.Molecules. 2022 Jan 8;27(2):387. doi: 10.3390/molecules27020387. Molecules. 2022. PMID: 35056702 Free PMC article.
References
-
- Lowery D.M., Lim D., Yaffe M.B. Structure and function of Polo-like kinases. Oncogene. 2005;24:248–259. - PubMed
-
- Degenhardt Y., Lampkin T. Targeting Polo-like kinase in cancer therapy. Clin. Cancer Res. 2010;16:384–389. - PubMed
-
- Strebhardt K., Ullrich A. Targeting polo-like kinase 1 for cancer therapy. Nat. Rev. Cancer. 2006;6:321–330. - PubMed
-
- Strebhardt K. Multifaceted polo-like kinases: Drug targets and antitargets for cancer therapy. Nat. Rev. Drug Discov. 2010;9:643–660. - PubMed
Publication types
MeSH terms
Substances
LinkOut - more resources
Full Text Sources
Other Literature Sources
Miscellaneous
