. 2012 Jan;10(1):e1001241.
doi: 10.1371/journal.pbio.1001241. Epub 2012 Jan 17.

Rapid evolution of enormous, multichromosomal genomes in flowering plant mitochondria with exceptionally high mutation rates

Affiliations

Rapid evolution of enormous, multichromosomal genomes in flowering plant mitochondria with exceptionally high mutation rates

Daniel B Sloan et al. PLoS Biol. 2012 Jan.

Abstract

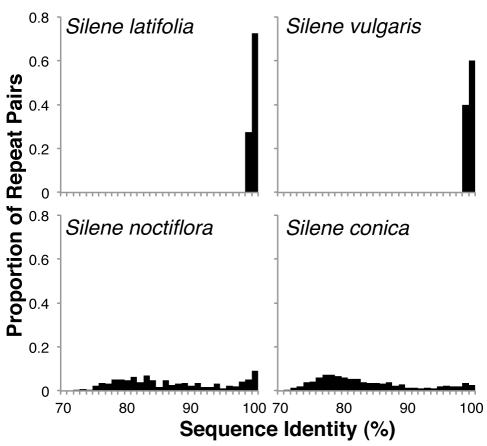
Genome size and complexity vary tremendously among eukaryotic species and their organelles. Comparisons across deeply divergent eukaryotic lineages have suggested that variation in mutation rates may explain this diversity, with increased mutational burdens favoring reduced genome size and complexity. The discovery that mitochondrial mutation rates can differ by orders of magnitude among closely related angiosperm species presents a unique opportunity to test this hypothesis. We sequenced the mitochondrial genomes from two species in the angiosperm genus Silene with recent and dramatic accelerations in their mitochondrial mutation rates. Contrary to theoretical predictions, these genomes have experienced a massive proliferation of noncoding content. At 6.7 and 11.3 Mb, they are by far the largest known mitochondrial genomes, larger than most bacterial genomes and even some nuclear genomes. In contrast, two slowly evolving Silene mitochondrial genomes are smaller than average for angiosperms. Consequently, this genus captures approximately 98% of known variation in organelle genome size. The expanded genomes reveal several architectural changes, including the evolution of complex multichromosomal structures (with 59 and 128 circular-mapping chromosomes, ranging in size from 44 to 192 kb). They also exhibit a substantial reduction in recombination and gene conversion activity as measured by the relative frequency of alternative genome conformations and the level of sequence divergence between repeat copies. The evolution of mutation rate, genome size, and chromosome structure can therefore be extremely rapid and interrelated in ways not predicted by current evolutionary theories. Our results raise the hypothesis that changes in recombinational processes, including gene conversion, may be a central force driving the evolution of both mutation rate and genome structure.


Conflict of interest statement

The authors have declared that no competing interests exist.

Figures

Figure 1
Figure 1. Sequence divergence, genome size, and gene content in seed plant mitochondria.
Branch lengths are scaled to the number of synonymous nucleotide substitution per site (d S) on the basis of an analysis of all shared protein genes. Genome size ranges are reported for species with multiple sequences available. Gene counts exclude duplicates and putative pseudogenes.
Figure 2
Figure 2. Levels of synonymous (d S) and nonsynonymous (d N) sequence divergence in terms of substitutions per site for protein genes in Silene mitochondrial genomes.
Estimates were generated using B. vulgaris and A. thaliana as outgroups.
Figure 3
Figure 3. Number of indels in mitochondrial protein genes and introns that are unique to each of the four Silene species.
Figure 4
Figure 4. Protein and RNA gene content in sequenced seed plant mitochondrial genomes.
Dark shading indicates the presence of an intact reading frame or folding structure, whereas light shading indicates the presence of only a putative pseudogene. The numbers at the bottom of each group indicate the total number of intact genes for that species. Note that the ccmFc gene, which is universally present in all other seed plants surveyed to date , is classified as a pseudogene in S. conica. It has experienced numerous structural mutations in this lineage, including multiple frame shifts in the second exon that introduce premature stop codons. However, cDNA sequencing confirmed that this gene is transcribed, spliced, and RNA edited in S. conica (unpublished data), so it is possible that the gene is still functional in its truncated form. In some cases, the presence of an intact gene may not indicate functionality. This is particularly true for tRNA genes embedded within recently transferred regions of plastid DNA ,. For example, the trnN(guu) and trnR(acg) genes in S. vulgaris may not be functional, as they are within a 2.6-kb region that appears to have been recently transferred from the plastid genome (on the basis of its perfect sequence identity with the exception of a single 18-bp deletion). These two tRNA genes are not orthologous to the plastid-derived copies of trnN(guu) and trnR(acg) in other seed plant mitochondria. Intron-containing plastid-derived tRNA genes such as trnA(ugc) in Bambusa, trnV(uac) in Cycas, trnK(uuu) in Vitis, and trnI(gau) in Zea are also unlikely to be functional. In Cycas, the trnL(uaa), trnP(ugg), trnQ(uug), trnR(ucu), and trnV(uac)- Ψ genes are classified on the basis of sequence homology to other land plant tRNAs even though their genomically encoded anticodons differ (CAA, CGG, CUG, CCU, and CAC, respectively). It is possible that these anticodons undergo C-to-U RNA editing to restore the ancestral codon as has been observed in other vascular plants ,. Plastid-derived tRNAs with substitutions in their anticodons, such as Citrullus trnT(ugu) and Silene latifolia trnP(ugg), are also classified (as pseudogenes) on the basis of homology.
Figure 5
Figure 5. Size distribution of repetitive content by the number of repeat pairs (left column) and total repeat length (right column).
Both datasets are based on all repeat pairs identified with BLAST by searching each genome against itself. Note that this method is different than counting individual repeat copies, which cannot be unambiguously identified when repeats exist in numerous partially overlapping copies, as they do in these genomes. For example, a repeat with four copies would be associated with six unique repeat pairs. Because of the enormous number of multicopy, overlapping repeats in S. conica, the total length of repeat pairs exceeds the size of the genome even though more than half of it is single-copy. For these same reasons, the distribution of repeat lengths in this figure differs from the repeat coverage statistics reported in Table 1, which consider what fraction of the genome is covered by repeats but not the total number of repeat pairs. The reported 50% coverage threshold represents the median of the total repeat length distribution.
Figure 6
Figure 6. Repeat-mediated recombinational activity in the low mutation rate S. latifolia and S. vulgaris mitochondrial genomes (A) and the fast-evolving S. noctiflora and S. conica mitochondrial genomes (B).
Each point represents a pair of repeats, and its position on the y-axis denotes the proportion of recombinant genome conformations detected with paired-end 454 reads. The dashed lines indicate the level at which equal frequencies of read pairs support recombinant and nonrecombinant conformations. The S. latifolia mitochondrial genome was not sequenced with 454 paired-end reads, but Southern blot hybridizations indicated that alternative genome conformations associated with its six-copy 1.4-kb repeat exist at roughly equivalent frequencies , as indicated by the large X.
Figure 7
Figure 7. Distribution of percent sequence identity between pairs of repeats detected by BLAST.
Only repeat pairs greater than 300 bp in length were used to calculate these distributions.
Figure 8
Figure 8. Silene mitochondrial genome sizes relative to all sequenced mitochondrial and eubacterial genomes from the National Center for Biotechnology Information (NCBI) Genome database.

References

    1. Mira A, Ochman H, Moran N. A. Deletional bias and the evolution of bacterial genomes. Trends Genet. 2001;17:589–596. - PubMed
    1. Petrov D. A. Mutational equilibrium model of genome size evolution. Theor Popul Biol. 2002;61:531–544. - PubMed
    1. Orgel L. E, Crick F. H. Selfish DNA: the ultimate parasite. Nature. 1980;284:604–607. - PubMed
    1. Doolittle W. F, Sapienza C. Selfish genes, the phenotype paradigm and genome evolution. Nature. 1980;284:601–603. - PubMed
    1. Cavalier-Smith T. Skeletal DNA and the evolution of genome size. Annu Rev Biophys Bioeng. 1982;11:273–302. - PubMed

Publication types

MeSH terms

Associated data