. 2012 Jan;9(1):e1001157.
doi: 10.1371/journal.pmed.1001157. Epub 2012 Jan 17.

Ensemble modeling of the likely public health impact of a pre-erythrocytic malaria vaccine

Affiliations

Ensemble modeling of the likely public health impact of a pre-erythrocytic malaria vaccine

Thomas Smith et al. PLoS Med. 2012 Jan.

Abstract

Background: The RTS,S malaria vaccine may soon be licensed. Models of impact of such vaccines have mainly considered deployment via the World Health Organization's Expanded Programme on Immunization (EPI) in areas of stable endemic transmission of Plasmodium falciparum, and have been calibrated for such settings. Their applicability to low transmission settings is unclear. Evaluations of the efficiency of different deployment strategies in diverse settings should consider uncertainties in model structure.

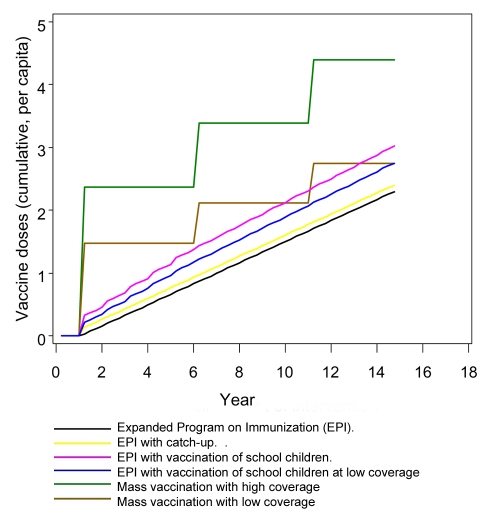
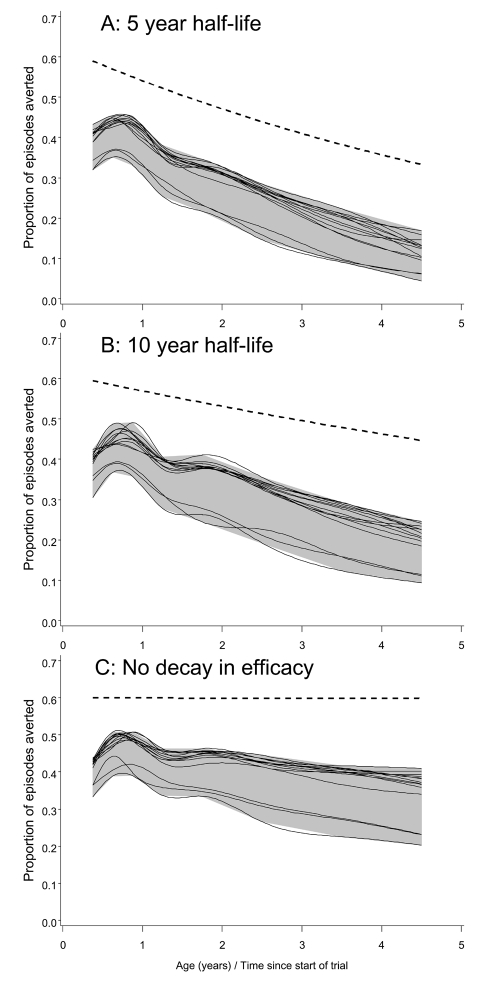
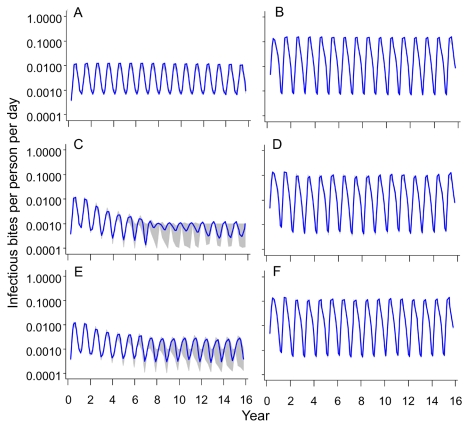
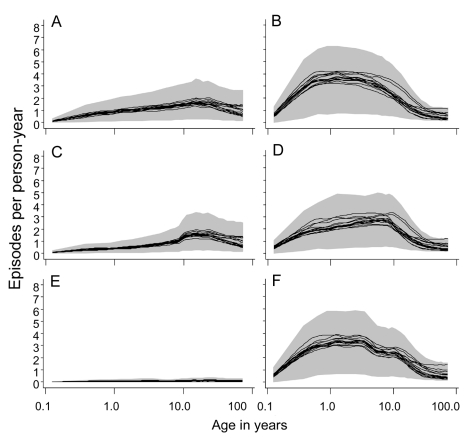
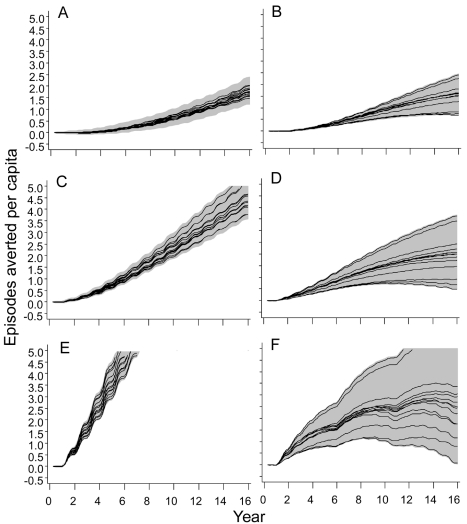
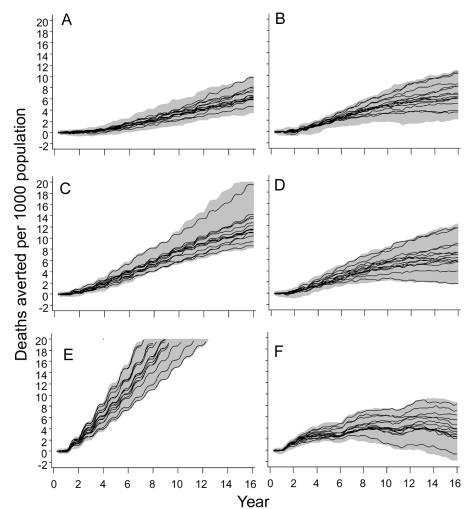
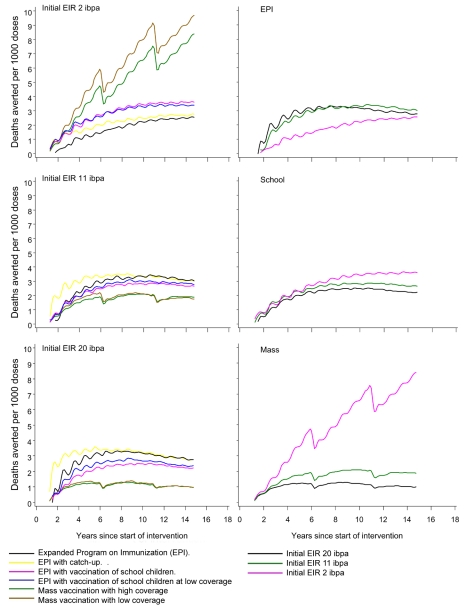
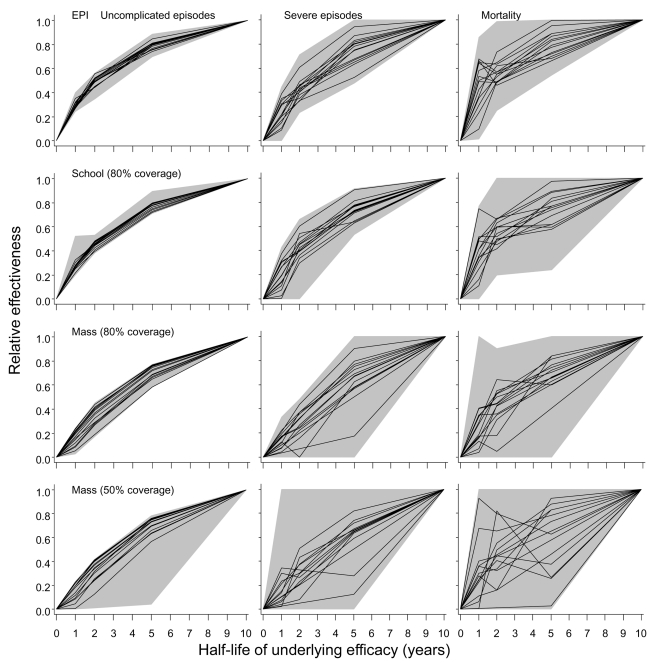
Methods and findings: An ensemble of 14 individual-based stochastic simulation models of P. falciparum dynamics, with differing assumptions about immune decay, transmission heterogeneity, and treatment access, was constructed. After fitting to an extensive library of field data, each model was used to predict the likely health benefits of RTS,S deployment, via EPI (with or without catch-up vaccinations), supplementary vaccination of school-age children, or mass vaccination every 5 y. Settings with seasonally varying transmission, with overall pre-intervention entomological inoculation rates (EIRs) of two, 11, and 20 infectious bites per person per annum, were considered. Predicted benefits of EPI vaccination programs over the simulated 14-y time horizon were dependent on duration of protection. Nevertheless, EPI strategies (with an initial catch-up phase) averted the most deaths per dose at the higher EIRs, although model uncertainty increased with EIR. At two infectious bites per person per annum, mass vaccination strategies substantially reduced transmission, leading to much greater health effects per dose, even at modest coverage.

Conclusions: In higher transmission settings, EPI strategies will be most efficient, but vaccination additional to the EPI in targeted low transmission settings, even at modest coverage, might be more efficient than national-level vaccination of infants. The feasibility and economics of mass vaccination, and the circumstances under which vaccination will avert epidemics, remain unclear. The approach of using an ensemble of models provides more secure conclusions than a single-model approach, and suggests greater confidence in predictions of health effects for lower transmission settings than for higher ones.


Conflict of interest statement

Thomas A. Smith is on the Editorial Board of PLoS Medicine. AB used to be employed by the PATH Malaria Organization which was supporting the development of RTS,S, the vaccine which is the focus of this paper. AB left PATH prior to any collaboration on this paper. All other authors have declared no competing interests. The views expressed are those of the authors.

Figures

Figure 1
Figure 1. Numbers of doses of vaccine delivered by various deployment strategies over time.
Figure 2
Figure 2. Efficacy in averting clinical episodes in simulated clinical trials.
The three panels correspond to different decay rates of vaccine efficacy: (A) 5-y half-life, (B) 10-y half-life, and (C) no decay. The dashed lines give the underlying efficacy. Each continuous line corresponds to a different model within the ensemble, and displays spline-smoothed estimates of efficacy in averting clinical disease. The grey area is an envelope enclosing all the simulation results. All simulations refer to the 20-ibpa transmission setting and the EPI schedule described in the Methods.
Figure 3
Figure 3. Simulated Entomological Inoculation Rates over time.
Figure 4
Figure 4. Age prevalence curves during the tenth year of follow-up.
(A) EIR = 2 ibpa, no intervention. (B) EIR = 20 ibpa, no intervention. (C) EIR = 2 ibpa, EPI vaccination. (D) EIR = 20 ibpa, EPI vaccination. (E) EIR = 2 ibpa, mass vaccination, high coverage. (F) EIR = 20 ibpa, mass vaccination, high coverage. The lines correspond to the median values of the five simulations for each model within the ensemble of the prevalence, computed from values averaged within each simulation over the full year; the grey areas are the envelopes delimited by the 2.5 and 97.5 percentiles of the simulations.
Figure 5
Figure 5. Age incidence curves during the tenth year of follow-up.
(A) EIR = 2 ibpa, no intervention. (B) EIR = 20 ibpa, no intervention. (C) EIR = 2 ibpa, EPI vaccination. (D) EIR = 20 ibpa, EPI vaccination. (E) EIR = 2 ibpa, mass vaccination, high coverage. (F) EIR = 20 ibpa, mass vaccination, high coverage. The lines correspond to the median values of the five simulations for each model within the ensemble of the incidence of clinical malaria, computed from values averaged within each simulation over the full year; the grey areas are the envelopes delimited by the 2.5 and 97.5 percentiles of the simulations.
Figure 6
Figure 6. Numbers of clinical episodes averted.
(A) EIR = 2 ibpa, EPI vaccination. (B) EIR = 20 ibpa, EPI vaccination. (C) EIR = 2 ibpa, EPI and school vaccination, high coverage. (D) EIR = 20 ibpa, EPI and school vaccination, high coverage. (E) EIR = 2 ibpa, mass vaccination, high coverage. (F) EIR = 20 ibpa, mass vaccination, high coverage. The lines correspond to the median values of the five simulations for each model within the ensemble of the episodes averted per capita, computed from values averaged within each simulation over the full year; the grey areas are the envelopes delimited by the 2.5 and 97.5 percentiles of the simulations.
Figure 7
Figure 7. Numbers of malaria-related deaths averted.
(A) EIR = 2 ibpa, EPI vaccination. (B) EIR = 20 ibpa, EPI vaccination. (C) EIR = 2 ibpa, EPI and school vaccination, high coverage. (D) EIR = 20 ibpa, EPI and school vaccination, high coverage. (E) EIR = 2 ibpa, mass vaccination, high coverage. (F) EIR = 20 ibpa, mass vaccination, high coverage. The lines correspond to the median values of the five simulations for each model within the ensemble of the deaths averted per 1,000 population, computed from values averaged within each simulation over the full year; the grey areas are the envelopes delimited by the 2.5 and 97.5 percentiles of the simulations.
Figure 8
Figure 8. Numbers of malaria-related deaths averted in relation to number of vaccine doses administered.
The values plotted are the medians of all simulations. In the left-hand panels, the different lines correspond to different deployment strategies; in the right-hand panels, the different lines correspond to different initial transmission intensities.
Figure 9
Figure 9. Effect of half-life of underlying efficacy on effectiveness of vaccination.
The three columns correspond to distinct outcomes (uncomplicated episodes, severe malaria, and malaria-related mortality [including both direct and indirect]). The rows correspond to different deployment strategies. The horizontal axis in each graph corresponds to the half-life of the underlying effect of the vaccine. The black lines give the median relative effectiveness during the first 10 y of the program for each model, where relative effectiveness is defined as the proportion of events averted divided by the proportion of events averted by a vaccine with a 10-y half-life. The grey areas correspond to the range of this relative effectiveness for all simulations (three simulations for each model and each half-life). All simulations refer to the 20-ibpa (initial) transmission setting.

Similar articles

Cited by

References

    1. London School of Hygiene and Tropical Medicine Public Health Forum. Malaria: waiting for the vaccine. London: Wiley; 1992.
    1. Bejon P, Lusingu J, Olotu A, Leach A, Lievens M, et al. Efficacy of RTS,S/AS01E vaccine against malaria in children 5 to 17 months of age. N Engl J Med. 2008;359:2521–2532. - PMC - PubMed
    1. Abdulla S, Oberholzer R, Juma O, Kubhoja S, Machera F, et al. Safety and immunogenicity of RTS,S/AS02D malaria vaccine in infants. N Engl J Med. 2008;359:2533–2544. - PubMed
    1. Ballou WR. The development of the RTS,S malaria vaccine candidate: challenges and lessons. Parasite Immunol. 2009;31:492–500. - PubMed
    1. Smith T, Killeen GF, Maire N, Ross A, Molineaux L, et al. Mathematical modeling of the impact of malaria vaccines on the clinical epidemiology and natural history of Plasmodium falciparum malaria: overview. Am J Trop Med Hyg. 2006;75:1–10. - PubMed

Publication types

MeSH terms

Substances