

Trends in resource utilization by children with neurological impairment in the United States inpatient health care system: a repeat cross-sectional study
- PMID: 22272190
- PMCID: PMC3260313
- DOI: 10.1371/journal.pmed.1001158
Trends in resource utilization by children with neurological impairment in the United States inpatient health care system: a repeat cross-sectional study
Abstract
Background: Care advances in the United States (US) have led to improved survival of children with neurological impairment (NI). Children with NI may account for an increasing proportion of hospital resources. However, this assumption has not been tested at a national level.
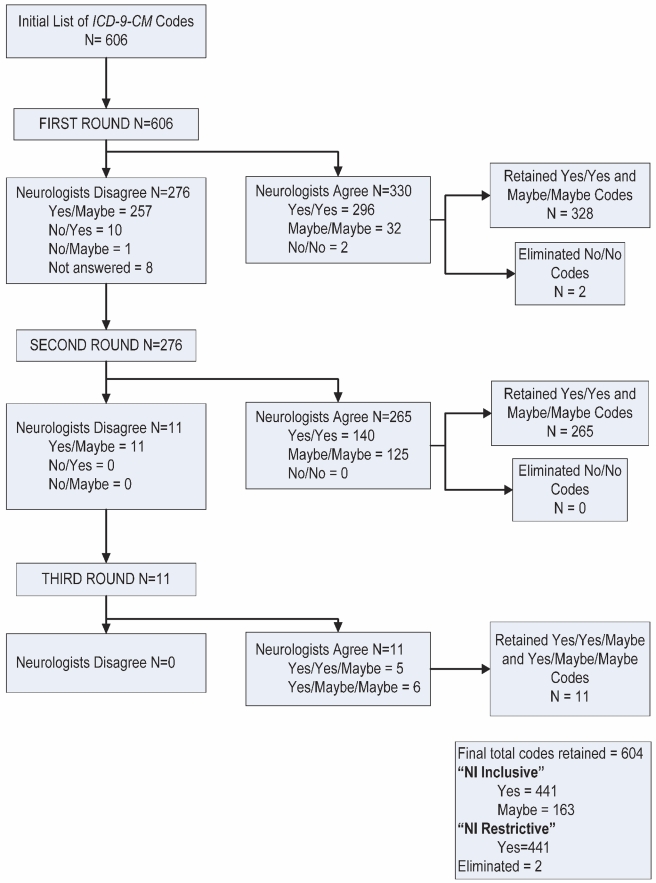
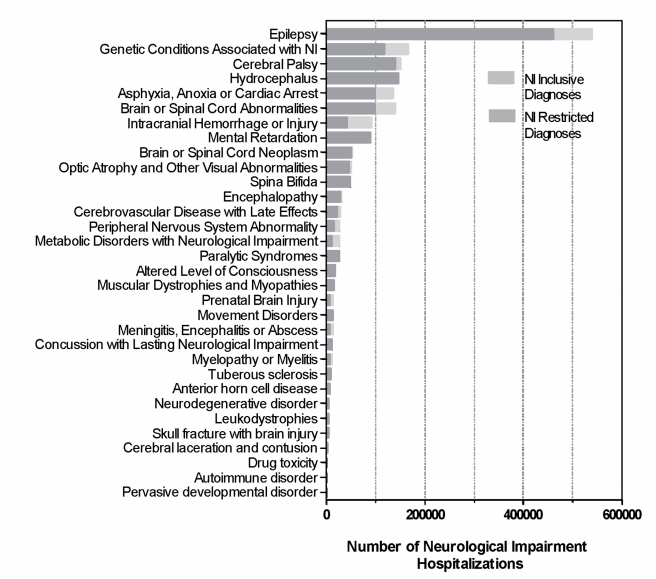
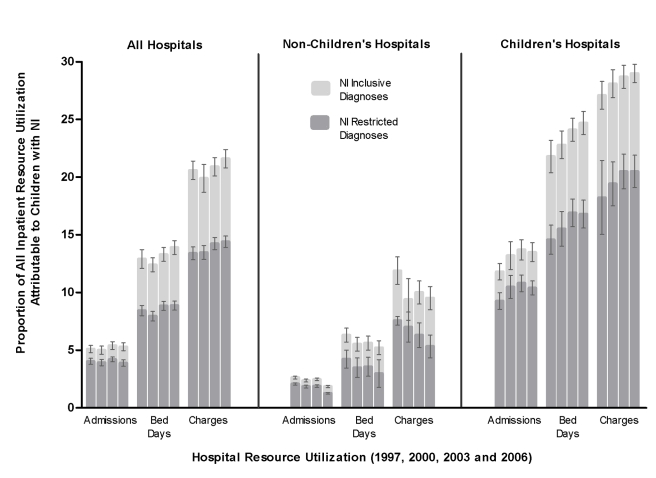
Methods and findings: We conducted a study of 25,747,016 US hospitalizations of children recorded in the Kids' Inpatient Database (years 1997, 2000, 2003, and 2006). Children with NI were identified with International Classification of Diseases, 9th Revision, Clinical Modification diagnoses resulting in functional and/or intellectual impairment. We assessed trends in inpatient resource utilization for children with NI with a Mantel-Haenszel chi-square test using all 4 y of data combined. Across the 4 y combined, children with NI accounted for 5.2% (1,338,590) of all hospitalizations. Epilepsy (52.2% [n = 538,978]) and cerebral palsy (15.9% [n = 164,665]) were the most prevalent NI diagnoses. The proportion of hospitalizations attributable to children with NI did not change significantly (p = 0.32) over time. In 2006, children with NI accounted for 5.3% (n = 345,621) of all hospitalizations, 13.9% (n = 3.4 million) of bed days, and 21.6% (US$17.7 billion) of all hospital charges within all hospitals. Over time, the proportion of hospitalizations attributable to children with NI decreased within non-children's hospitals (3.0% [n = 146,324] in 1997 to 2.5% [n = 113,097] in 2006, p<.001) and increased within children's hospitals (11.7% [n = 179,324] in 1997 to 13.5% [n = 209,708] in 2006, p<0.001). In 2006, children with NI accounted for 24.7% (2.1 million) of bed days and 29.0% (US$12.0 billion) of hospital charges within children's hospitals.
Conclusions: Children with NI account for a substantial proportion of inpatient resources utilized in the US. Their impact is growing within children's hospitals. We must ensure that the current health care system is staffed, educated, and equipped to serve this growing segment of vulnerable children.
Conflict of interest statement
RS has received grant funding from K23 HD 052553, National Institute of Child Health and Human Development, NIH. RS has also given talks as Chair of PRIS Network (part of the Network, and his time is funded by the Child Health Corporation of America) and has been asked to speak in his capacity as a hospitalist investigator with receipt of an honorarium (Rady Childrens Hospital; Alberta Children's Hospital (both 2010)). RS has also acted as an expert witness on a behalf of a plaintiff for Jackson & Campbell, P.C., Washington D.C., because of his research on children with neurological impairment and their care. All other authors have declared that no competing interests exist.
Figures
References
-
- Arpino C, Compagnone E, Montanaro ML, Cacciatore D, De Luca A, et al. Preterm birth and neurodevelopmental outcome: a review. Childs Nerv Syst. 2010;26:1139–1149. - PubMed
-
- Meadow W, Lee G, Lin K, Lantos J. Changes in mortality for extremely low birth weight infants in the 1990s: implications for treatment decisions and resource use. Pediatrics. 2004;113:1223–1229. - PubMed
-
- Plioplys AV, Kasnicka I, Lewis S, Moller D. Survival rates among children with severe neurologic disabilities. South Med J. 1998;91:161–172. - PubMed
-
- Tennant PW, Pearce MS, Bythell M, Rankin J. 20-year survival of children born with congenital anomalies: a population-based study. Lancet. 2010;375:649–656. - PubMed
-
- Sullivan PB, Lambert B, Rose M, Ford-Adams M, Johnson A, et al. Prevalence and severity of feeding and nutritional problems in children with neurological impairment: Oxford Feeding Study. Dev Med Child Neurol. 2000;42:674–680. - PubMed
Publication types
MeSH terms
Grants and funding
LinkOut - more resources
Full Text Sources
Medical
