. 2012;2(1):3-44.
doi: 10.7150/thno.3463. Epub 2012 Jan 1.

Targeting strategies for multifunctional nanoparticles in cancer imaging and therapy

Affiliations

Targeting strategies for multifunctional nanoparticles in cancer imaging and therapy

Mi Kyung Yu et al. Theranostics. 2012.

Abstract

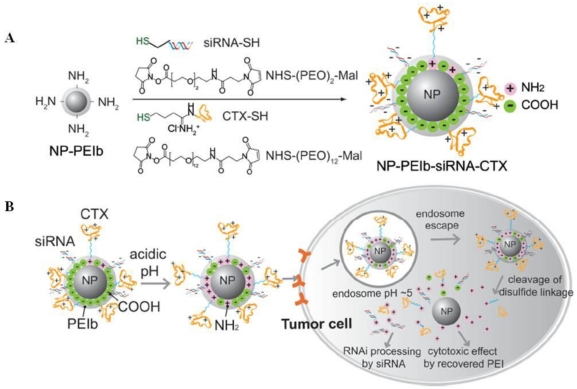
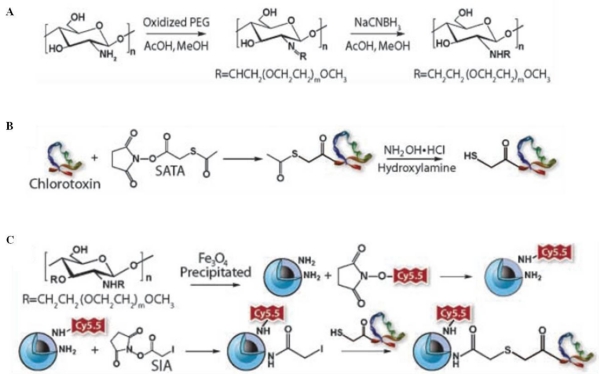
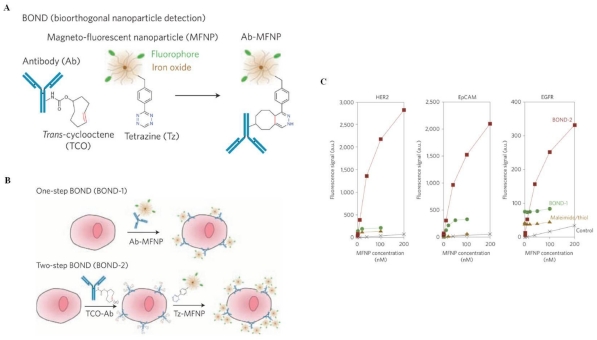
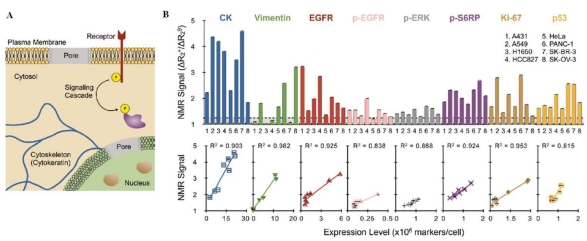
Nanomaterials offer new opportunities for cancer diagnosis and treatment. Multifunctional nanoparticles harboring various functions including targeting, imaging, therapy, and etc have been intensively studied aiming to overcome limitations associated with conventional cancer diagnosis and therapy. Of various nanoparticles, magnetic iron oxide nanoparticles with superparamagnetic property have shown potential as multifunctional nanoparticles for clinical translation because they have been used asmagnetic resonance imaging (MRI) constrast agents in clinic and their features could be easily tailored by including targeting moieties, fluorescence dyes, or therapeutic agents. This review summarizes targeting strategies for construction of multifunctional nanoparticles including magnetic nanoparticles-based theranostic systems, and the various surface engineering strategies of nanoparticles for in vivo applications.

Keywords: Multifunctional nanoparticles; bioconjugation; long circulation; magnetic nanoparticles; surface engineering; targeting ligand.


Conflict of interest statement

Conflict of Interest: The authors have declared that no conflict of interest exists.

Figures

Figure 1
Figure 1
(A) Schematic diagram showing EGFRvIII-IONPs. (B-F) Survival studies of nude mice implanted with the U87ΔEGFRvIII glioma model. (B) T2-weighted MRI showing a tumor region with a bright signal 7 days after tumor implantation (arrow). (C) A tumor is shown (arrow) after injection of a gadolinium contrast agent (Gd-DTPA). (D) The MRI signal decreased (arrow) after CED of EGFRvIIIAb-IONPs. (E) EGFRvIIIAb-IONP dispersion and T2 signal decrease (arrow) 4 days after CED. (F) Survival curve of the nude mice bearing U87ΔEGFRvIII cells after a treatment regimen of MRI-guided CED: the untreated control, IONPs, EGFRvIIIAb, or EGFRvIIIAb-IONPs. Reproduced with permission from ref. .
Figure 2
Figure 2
(A) Schematic diagram showing the formulation of scAbPSCA-Dtxl/SPIO-NPs. T2-weighted imaging (B) and the MR signal intensity (C) of PC3 cells (1×10⁶) after 2 h incubation with (a) scAbPSCA-Dtxl/SPIO-NPs, (b) PEG-PLGA-Dtxl/SPIO-NPs, or (c) Endorem® with 1.5 T MRI scanning. Reproduced with permission from ref. .
Figure 3
Figure 3
(A) Schematic diagram showing the synthesis of MN-EPPT-siBIRC5. (B) Representative pre-contrast images and 24 h post-contrast T2-weighted images (top), and color-coded T2 maps (bottom) of the tumor-bearing mice intravenously injected with MN-EPPT-siBIRC5 (10 mg/kg Fe). (C) Relative tumor volume measurements of MN-EPPT-siBIRC5- and MN-EPPT-siSCR-injected animals over the course of treatment. Reproduced with permission from ref. .
Figure 4
Figure 4
(A) Schematic diagram of the NPCP-Cy5.5-CTX nanoprobes. In vivo MR images of ND2:SmoA1 (B) and wild-type mice (C) acquired before and 48 h after administration of either NPCP-CTX or the NPCP nanoprobes. Colorized R2 maps of the brain region were superimposed onto the proton density-weighted images. (D-E) In vivo near-IR fluorescence images of autochthonous medulloblastoma tumors in ND2:SmoA1 mice injected with NPCP-Cy5.5-CTX or NPCP-Cy5.5, alongside those receiving no injection: 2 h post-injection (D) and 120 h post-injection (E). Ex vivo fluorescence images of mice brains from the same mice following necropsy (inset). The spectral gradient bar corresponds to the fluorescence intensity (p/s/cm2/sr) in the images. Reproduced with permission from ref. .
Figure 5
Figure 5
(A) Schematic representation and TEM image of RGD-Dox-NP (scale bar indicates 100 nm). (B) Vascular disruption in the mouse Matrigel model with intravenous injection of PBS or αvβ3-targeted RGD-Dox-NPs on days 1, 3, and 5. After treatment, mice were intravenously injected with fluorescein-labeled G. simplicifolia lectin, and the plugs were removed and imaged by scanning confocal microscopy. (C) Suppression of metastasis in an orthotopic model of pancreatic cancer. After surgical implantation of the cells, mice were treated on days 5, 7, and 9 with RGD-Dox-NPs, RAD-Dox-NPs, free Dox, or PBS (each with 1 mg/kg total Dox per dose). On day 11, the primary tumor and the hepatic hilar lymph node were resected and weighed. Reproduced with permission from ref. .
Figure 6
Figure 6
Schematic illustration of the silica nanoporous particle-supported lipid bilayer, depicting the disparate types of therapeutic and diagnostic agents that can be loaded within the nanoporous silica core, as well as the ligands that can be displayed on the surface of the nanoparticle. Reproduced with permission from ref. .
Figure 7
Figure 7
(A) Schematic representation of nanoparticle communication to achieve amplified tumor targeting. Tumor-targeted signaling nanoparticles (blue) broadcast the tumor location to the receiving nanoparticles (red) present in circulation. (B) Shown are the harnessing of the biological cascade to transmit and amplify nanoparticle communication and the molecular signaling pathway between the signaling and receiving components. (C) Thermographic images of the photothermal NRs with heating. Seventy-two hours after NR or saline injection, mice were co-injected with FXIII-NWs and untargeted control-NWs, and their right flanks were broadly irradiated (top). Twenty-four hours post-irradiation, whole-animal fluorescence imaging revealed the distribution of the receiving nanoparticles (bottom). (D) Amplified tumor therapy with communicating nanoparticles. Tumor volumes following a single treatment with the communicating nanoparticle systems and controls. Reproduced with permission from ref. .
Figure 8
Figure 8
(A) Schematic diagram showing bioconjugation of HAuNS-siRNA and photothermal-induced siRNA release. (B) Schematic diagram showing the synthesis of F-PEG-HAuNS-siRNA and the proposed intracellular events following near-IR irradiation. (C) Effect of p65 siRNA photothermal transfection combined with irinotecan delivered to nude mice bearing HeLa cancer xenografts. (D) Micro-PET/CT imaging of nude mice bearing HeLa cervical cancer xenografts in right rear leg 6 h after intravenous injection of F-PEG-HAuNS-siRNA(DOTA-64Cu) or PEG-HAuNS-siRNA(DOTA-64Cu). Arrowheads indicate the tumors. Reproduced with permission from ref. .
Figure 9
Figure 9
(A) Schematic diagram showing the preparation of Apt-hybr-TCL-SPIONs and Dox@Apt-hybr-TCL-SPIONs. (B) T2-weighted fast spin echo images at the level of the LNCaP tumor on the right side of the mouse taken 0, 2, 24, and 48 h after injection of Apt-hybr-TCL-SPIONs or scrApt-hybr-TCL-SPIONs. The dashed circle indicates the xenograft tumor region. (C) The RSE (%) in the tumor areas of the Apt-hybr-TCL-SPION- and scrApt-hybr-TCL-SPION-treated mice were recorded from the T2-weighted images as a function of time. Reproduced with permission from ref. .
Figure 10
Figure 10
(A) Schematic representation of the transferrin targeted nanoparticle system. (B) Confocal images of post-treatment biopsy sections from patients A, B, and C. Left, Au-PEG-AD stain; middle, DAPI stain; right, merged images. The abbreviations are as follows: epi, epidermis, m; melanophage; s, skin side; t, tumor side. (C) qRT-PCR and western blot analysis of RRM2 protein expression in patient samples C2pre and C2post. The asterisk denotes the archived samples; the dagger denotes the samples obtained during the trial. Reproduced with permission from ref. .
Figure 11
Figure 11
Schematic diagram of the sequence of steps in the synthesis of a magnetic drug targeted carrier encapsulated in a thermosensitive smart polymer, and the drug release process. Reproduced with permission from ref. .
Figure 12
Figure 12
Schematic illustration of the coupling of the c(RGDyK) peptide to Fe3O4 nanoparticles. Reproduced with permission from ref. .
Figure 13
Figure 13
Schematic diagram showing the preparation of (A) the multifunctional NP-PEI-siRNA-CTX nanovector and (B) intracellular uptake, extracellular trafficking, and processing of the nanovector in tumor cells. Reproduced with permission from ref. .
Figure 14
Figure 14
Synthesis of NPCP-Cy5.5-CTX nanoprobes. (A) PEG-grafted chitosan, (B) sulfhydryl functionalization of CTX, and (C) CTX and Cy5.5 conjugation to NPCP. Reproduced with permission from ref. .
Figure 15
Figure 15
(A) Schematic diagram showing the conjugation chemistry between an antibody and a nanoparticle. (B) Application of BOND for one-step (direct) and two-step targeting of nanoparticles to cells. Note that the antibody and tetrazine are shown to be present in multiple copies per nanoparticle. (C) Comparison of different nanoparticle targeting strategies. SKBR-3, HCT116, and A549 cells were labeled with different concentrations of MFNPs using the two-step BOND-2 or direct MFNP immuno-conjugates, and the fluorescence signal was measured using flow cytometry. MFNP immuno-conjugates were prepared either via maleimide/thiol or TCO/Tz (BOND-1) chemistries. The control samples were incubated with Tz-MFNP only. Reproduced with permission from ref. .
Figure 16
Figure 16
(A) Semipermeabilization of intact cells allows for nanoparticle targeting to a variety of intracellular biomarkers. Indicators of cell growth, activation, and survival. (B) Profiling scant tumor cell populations for key biomarkers of cancer using DMR. Detection of eight biomarkers in eight different cell lines using MFNPs based on NMR signal (top). Magnetic measurements showed an excellent correlation with the marker expression levels determined independently using antibody staining (bottom). Reproduced with permission from ref. .
Figure 17
Figure 17
Representations of different PEG conformations, formed through their incorporation onto surfaces at different densities. (A) Low surface coverage levels of PEG lead to the “mushroom” configuration (D>Rf). (B) High surface coverage levels restrict the mobility of the PEG chains and lead to the “brush” configuration (D
Figure 18
Figure 18
Three parameters were varied to optimize in vivo tumor targeting: the shape of the nanoparticle, the type of the targeting ligand, and the nature of the molecular linker. Two types of surface linkers were used to attach the targeting groups to the magnetic NWs or NSs. A short hydrocarbon places the targeting peptide (either F3 or CREKA, green lines) in close proximity to the dextran-coated nanostructure. A 5 kDa PEG linker places the targeting peptide further from the surface. The number of targeting groups per NW was varied to maximize the in vivo circulation time and optimize the in vivo tumor-targeting efficiency. These linker chemistries were tested on magnetic NSs. The NWs consisted of several NS cores linked together in a chain. Reproduced with permission from ref. .

Similar articles

Cited by

References

    1. Boyle P, Levin B. World Cancer Report. World Health Organization Press. 2008.
    1. Jemal A, Siegel R, Xu J, Ward E. Cancer statistics. CA Cancer J Clin. 2010;60:277–300. - PubMed
    1. Maeda H. The enhanced permeability and retention (EPR) effect in tumor vasculature: the key role of tumor-selective macromolecular drug targeting. Adv Enzyme Regul. 2001;41:189–207. - PubMed
    1. Allen TM. Ligand-targeted therapeutics in anticancer therapy. Nat Rev Cancer. 2002;2:705–63. - PubMed
    1. Torchilin VP. Nanoparticulates as drug carriers. Imperial college press. 2006.