. 2012;7(1):e28694.
doi: 10.1371/journal.pone.0028694. Epub 2012 Jan 17.

Multi-parametric analysis and modeling of relationships between mitochondrial morphology and apoptosis

Affiliations

Multi-parametric analysis and modeling of relationships between mitochondrial morphology and apoptosis

Yara Reis et al. PLoS One. 2012.

Abstract

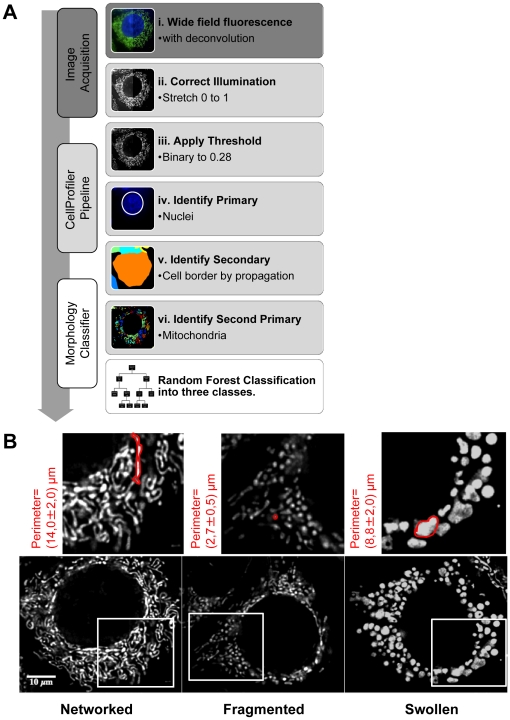
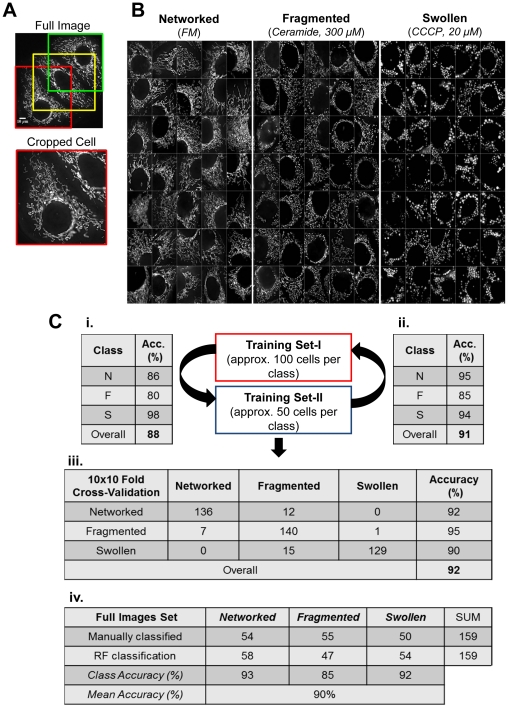
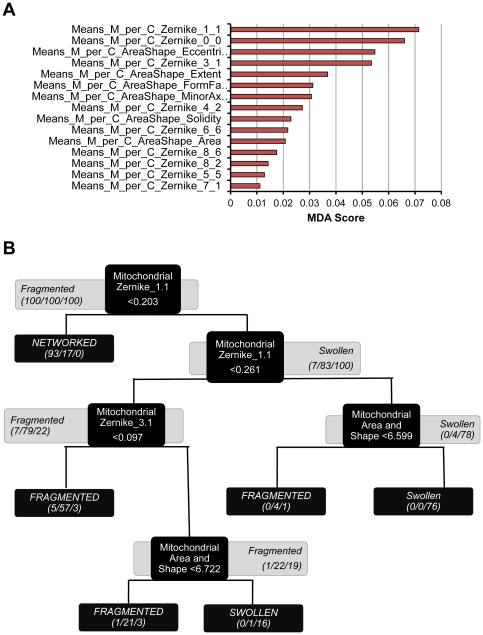
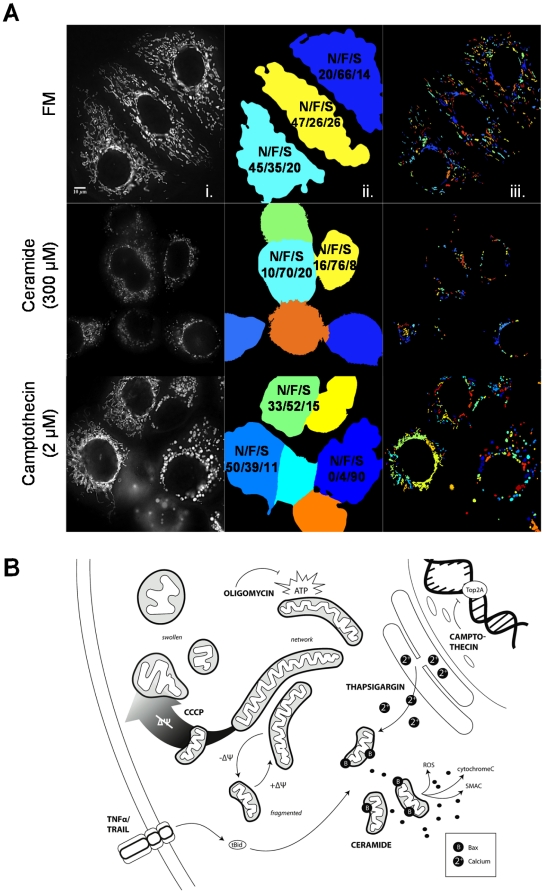
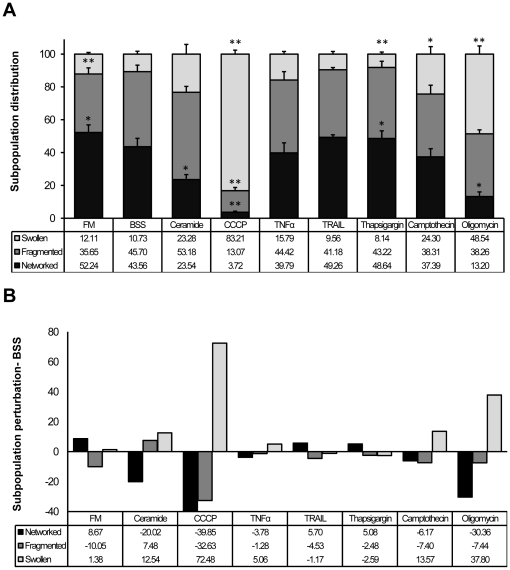
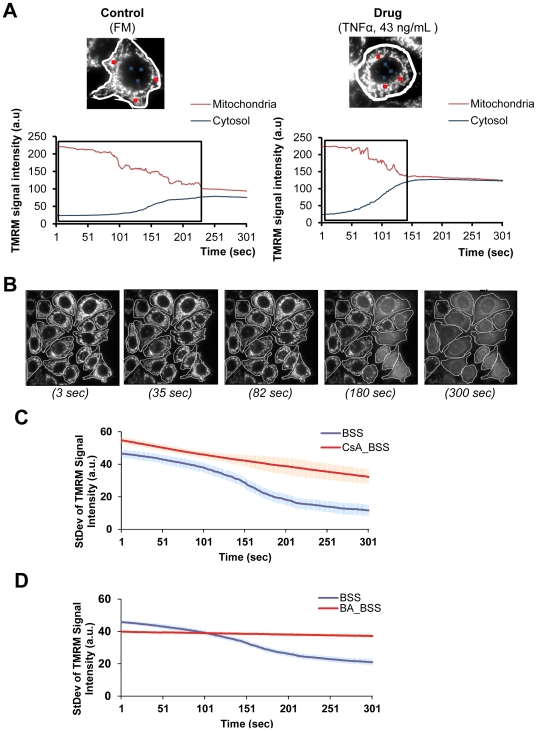
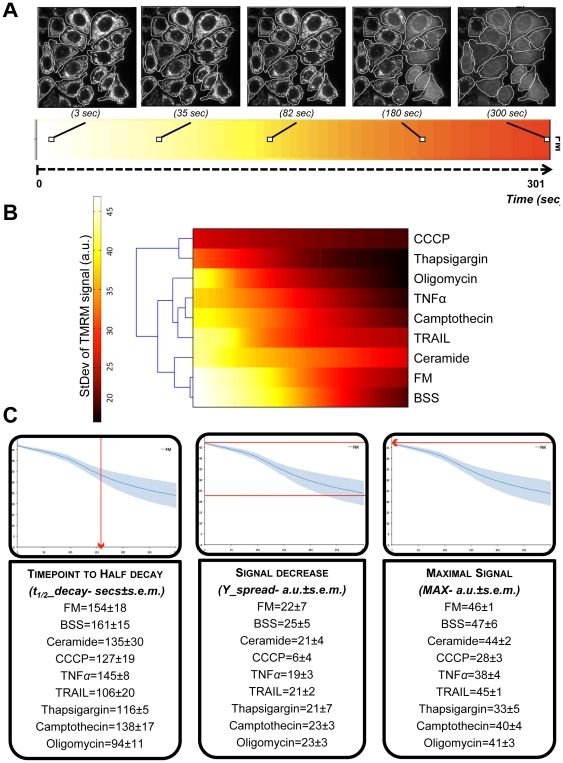
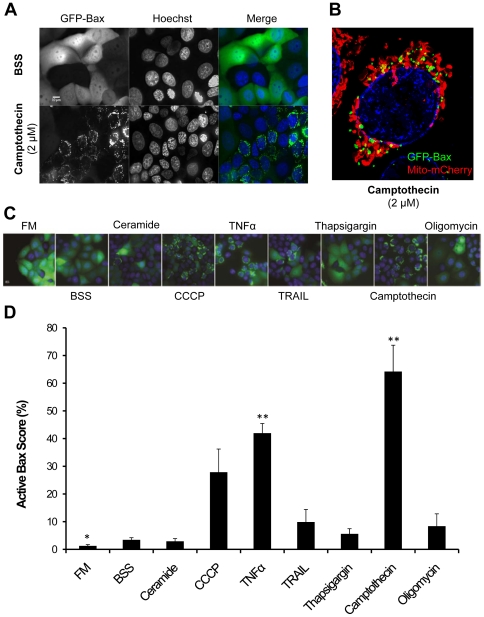
Mitochondria exist as a network of interconnected organelles undergoing constant fission and fusion. Current approaches to study mitochondrial morphology are limited by low data sampling coupled with manual identification and classification of complex morphological phenotypes. Here we propose an integrated mechanistic and data-driven modeling approach to analyze heterogeneous, quantified datasets and infer relations between mitochondrial morphology and apoptotic events. We initially performed high-content, multi-parametric measurements of mitochondrial morphological, apoptotic, and energetic states by high-resolution imaging of human breast carcinoma MCF-7 cells. Subsequently, decision tree-based analysis was used to automatically classify networked, fragmented, and swollen mitochondrial subpopulations, at the single-cell level and within cell populations. Our results revealed subtle but significant differences in morphology class distributions in response to various apoptotic stimuli. Furthermore, key mitochondrial functional parameters including mitochondrial membrane potential and Bax activation, were measured under matched conditions. Data-driven fuzzy logic modeling was used to explore the non-linear relationships between mitochondrial morphology and apoptotic signaling, combining morphological and functional data as a single model. Modeling results are in accordance with previous studies, where Bax regulates mitochondrial fragmentation, and mitochondrial morphology influences mitochondrial membrane potential. In summary, we established and validated a platform for mitochondrial morphological and functional analysis that can be readily extended with additional datasets. We further discuss the benefits of a flexible systematic approach for elucidating specific and general relationships between mitochondrial morphology and apoptosis.


Conflict of interest statement

Competing Interests: The authors have declared that no competing interests exist.

Figures

Figure 1
Figure 1. Mitochondrial morphology classification.
A) Method pipeline - Principal modules: 1- Image acquisition; 2 - CellProfiler analysis; 3- Random Forest (RF) classification. MCF-7 cells stably expressing Mito-GFP were submitted to different apoptotic drugs for 6 hours at 37°C. Microscopic images were randomly acquired with a DeltaVision microscope and deconvolved: (i) shows half non-deconvolved (left) and half deconvolved (right) cell. Images were loaded into the following CellProfiler pipeline: (ii) illumination correction; (iii) threshold application; (iv) primary object (cell) identification from based on Hoeschst-labeled nuclei; (v) identification of cell borders; (vi) segmentation of individual mitochondria. Finally, 69 relative features were extracted and exported to build a Random Forest (RF) tree classifier. B) Cell-based classification - MCF-7 cells stably expressing Mito-GFP were incubated 6 hours under controlled conditions to induce networked (FM), fragmented (ceramide, 300 µM) and swollen (CCCP, 20 µM) mitochondria. Average perimeter values (in red) were measured from 10 mitochondria present in the zoomed region. Representative images correspond to the middle slice from 3D stacks.
Figure 2
Figure 2. Establishment and validation of the Random Forest (RF) classifier.
A) Individual cell analysis- training sets were built from manually-cropped single cells. An example of a “full image” with regions of interest (ROIs) for individual cells and a corresponding “cropped cell” are depicted. B) Phenotypic variability- MCF-7 stably expressing Mito-GFP cells were incubated 6 hours at 37°C with the 3 control conditions: full medium (FM), ceramide (300 µM) and CCCP (20 µM). Shown here are representative examples of mitochondrial phenotypes manually selected for training each class. C) Random Forest classifier- (i) The classification algorithm was first trained with training set I (approx. 100 cropped cells per class) and tested in training set II (approx. 50 cropped cells per class); (ii) Classifier was trained with training set II and validated on training set I. (iii) Both datasets (set I and set II) were combined and used to train the final model. Each tree in the ensemble was calculated using a subset of cells stratified according to class and experimental origin. A 10×10 fold cross validation gives an overall accuracy of 92%. (iv) Comparison of results obtained for individual cells manually classified and the same set of cells automatically classified in their original image by our classifier. For comparison purposes, RF results were reduced to one class showing the major score from Networked/Fragmented/Swollen (N/F/S) intracellular populations.
Figure 3
Figure 3. Extracted features and classification.
A) MDA score- features used to build the Random Forest (RF) classifier ordered by its mean decrease in accuracy (MDA) value (%). Here we present the most relevant 10 CellProfiler features resulting from the 10×10 fold cross-validation. B) Representative decision tree- Tree consists of fork nodes, each labeled with an attribute and an intermediate class decision, and leaf nodes representing the final morphology classes (N/F/S). Feature/Split selection for the tree building process was weighted by the respective cost (1/MDA) score.
Figure 4
Figure 4. Population wide analysis of mitochondrial morphology.
A) CellProfiler pipeline applied to “Full Images”- (i) Representative examples of images as obtained by the DVRT microscope after deconvolution; (ii) Cell border identification and segmentation with final classification for each considered cell (color code corresponds to single cell segmentation); (iii) Mitochondrial segmentation per cell (color code corresponds to single mitochondrion segmentation). Here we present examples for 6 hours incubation (37°C) in control condition (FM) and drug conditions (ceramide, 300 µM, camptothecin, 2 µM). Percentage values of Networked/Fragmented/Swollen (N/F/S) mitochondria are attributed to each cell. These values (N/F/S) can be averaged per cell to obtain whole cell population shifts on mitochondrial morphology under the tested condition. B) Cartoon scheme representing the tested apoptotic drugs and its targets. MCF-7 stably expressing Mito-GFP were incubated for 6 hours at 37°C with 7 different apoptotic drugs inducing a variety of cellular stress: calcium overload (thapsigargin, 1 µM); DNA synthesis inhibition (camptothecin, 2 µM); ATP synthesis inhibition (oligomycin, 10 µM); death receptor (DR) pathway activation (TNFα, 43 ng/mL and TRAIL, 20 ng/mL); mitochondrial fragmentation (ceramide, 300 µM); as well as a mitochondrial uncoupler (CCCP, 20 µM). The scheme summarizes the subcellular impact of our drug selection and depicts the three possible morphologic states of mitochondria: networked, fragmented and swollen. For example, DR activation activates pro-apoptotic tBid, which leads to Bax activation at the mitochondria. Mitochondria are shown in a fragmented state during cytosolic release of pro-apoptotic signaling factors and related to a swollen stated upon loss of ΔΨm (gradient arrow).
Figure 5
Figure 5. Mitochondrial morphologic classes quantification in response to apoptotic stimuli.
A) Mitochondrial classes distribution during apoptosis- Column chart shows the Random Classifier (RF) classification into networked (black), fragmented (gray) and swollen (white) (N/F/S) for the different conditions. Values are given as mean percentage ± s.e.m. of N/F/S per cell for each N. (N = 3, approx. 300 cells per condition; *, P≤0.05, * *, P≤0.01, t-test against BSS). B) Normalization with control- results plotted in A are here normalized against BSS.
Figure 6
Figure 6. Mitochondrial membrane sensitivity to apoptotic stimuli.
A) Mitochondrial membrane potential (ΔΨm)- MCF-7 wild-type (wt) cells were incubated with tetramethyl rhodamine methyl-ester (TMRM, 25 nM) for 25 minutes at 37°C after 6 hours treatment with the apoptotic drugs. Sequential images of TMRM fluorescence were acquired every second using exposure times of 20 milliseconds, during a total of 5 minutes. Here we show the TMRM signal over the 5 minutes time for one cell incubated under full medium (FM) control condition and a cell incubated with a drug (TNFα, 43 ng/mL). The curve plots represent the TMRM signal variation over time in a mitochondrial region (red) and in the cytosol/nucleus region (blue)- here is shown the mean value from the 3 regions depicted in the image. B) Standard deviation (StDev) of TMRM signal- Distribution of the TMRM signal throughout the whole cell was followed over time by the StDev value that corresponds to the standard deviation of the average gray values within the ROI selection (each individual cell, in white). A single focal plane for 3, 35, 82, 180 and 300 seconds in cells under FM are shown. C) Cyclosporin A (CsA)- MCF-7 wt cells were treated with CsA (5 µM, 30 minutes) prior to 6 hours incubation in BSS, followed by TMRM addition as described above. D) Bongkrekic acid (BA)- MCF-7 wt cells were treated with BA (50 µM, 1 hour) prior to 6 hours incubation in BSS, followed by TMRM as described. (Mean values ± s.e.m. per condition are shown; experiments N = 2, approx. 100 cells per condition were followed).
Figure 7
Figure 7. ΔΨm loss and derived dataset.
A) Standard deviation (StDev) of TMRM signal as a heatmap- mean values of StDev were translated into a heatmap (color scaled from 0 to 50 in arbitrary units, a.u.). B) Heatmap of StDev values over time for all conditions and derived dendogram (left side diagram in black) illustrates the similarity of responses (Euclidean clustering). C) Derived dataset- Tree parameters were extracted per each StDev curve: 1. t1/2_decay- time that takes for the signal to reach half of its initial value; 2. Y_spread- Total decrease of the signal over time; 3. MAX- The initial maximum value. These parameters were extracted by using of a MATLAB function (see METHODS for details). Boxes show a representative curve example for the StDev curve of FM over time (301 seconds). (Mean values ± s.e.m. per drug are shown; experiments N = 4, approx. 400 cells per condition were followed).
Figure 8
Figure 8. Bax clustering under apoptotic stress.
A) Bax clustering- MCF-7 cells stably expressing GFP-Bax were incubated 6 hours at 37°C with the different conditions and nuclei were stained with Hoechst (100 ng/mL). Here is shown a representative example of basal levels of Bax activation (BSS) and an example of Bax activation under camptothecin (2 µM). B) Active Bax translocates to the mitochondria- MCF-7 cells stably expressing GFP-Bax were transiently transfected with mito-mCherry and incubated 6 hours (37°C) with camptothecin (2 µM) (Hoechst for nuclei). The 3D rendering (ImageJ) image shows GFP-Bax (green) translocated to mitochondria (in red). C) Bax clustering- Representative microscope region for each pro-apoptotic condition is shown. D) Bax levels- Cells with GFP-Bax clusters were scored as “positive” for Bax activation. D) Cells “positive” for activated Bax were scored and plotted as shown. Values are presented as mean percentage ± s.e.m. (N = 5, approx. 500 cells/condition; *, P≤0.05, * *, P≤0.01, t-test). Images were acquired with a DVRT scope and a 40× Objective.
Figure 9
Figure 9. Ensemble of parameters extract from imaging datasets.
Data concerning mitochondrial morphology classification, Bax activation scores and ΔΨm derived dataset were acquired for matched apoptotic condition after 6 hour incubation at 37°C. Shown are the ensemble datasets plotted together as a radar plot. This approach illustrates how each of the acquired parameters (mitochondrial morphology classes, ΔΨm subset and Bax activation) varies among tested conditions. i) Subset of results for control morphology conditions: FM, BSS, ceramide and CCCP. ii) Subset of results for death receptor ligands, illustrating. It is possible to observe distinct mitochondrial responses of TNFα and TRAIL.
Figure 10
Figure 10. Fuzzy Logic modeling.
A) Root mean square error (RMSE) of all 30 models. After assembly, all Single Input-Single Output (SISO) models were trained with the data for the corresponding interaction. Model accuracy was measured upon calculation of RMSE. Here are plotted the RMSE for all possible hypothesis (H): H1. “Individual mitochondrial morphology classes cause Bax”; H2. “Bax is responsible for morphology classes”; H3. “Bax causes each of mitochondrial membrane potential (ΔΨm) subset”; H4. “ΔΨm subset induces Bax”; H5. “Mitochondrial morphology induces ΔΨm subset”; H6. “Each of the ΔΨm subset is responsible for the morphologic classes”. First selection was made by discarding all models with a RMSE>15 (threshold in red). Secondly, the least errors between “mirror-models” were chosen (black bars). For clarity, H1-model is the “mirror-model” of the H2-model as H3-model is the opposite of H4-model and as H5-model is for H6-model. B) Detailed causality predictions between datasets- Scheme representing the final 6 most relevant predictions out of the 30 models. To assign these directional arrows, associated RMSE errors of the individual “mirror-models” were compared, e.g. H1-RMSE against H2-RMSE. Arrow direction was chosen based on the smaller error between “mirror-models” per dataset: Morphology, Bax and ΔΨm. The numeric values associated with the arrows correspond to the actual RMSE value resultant for the directional model prediction. C) Simplified scheme summarizing main interactions and causality suggested by our modeling results.

Similar articles

Cited by

References

    1. Tsujimoto Y, Nakagawa T, Shimizu S. Mitochondrial membrane permeability transition and cell death. Biochimica et biophysica acta. 2006;1757:1297–1300. - PubMed
    1. Henry-Mowatt J, Dive C, Martinou J, James D. Role of mitochondrial membrane permeabilization in apoptosis and cancer. Oncogene. 2004;23:2850–2860. - PubMed
    1. Bereiter-Hahn J, Vöth M. Dynamics of mitochondria in living cells: shape changes, dislocations, fusion, and fission of mitochondria. Microscopy research and technique. 1994;27:198–219. - PubMed
    1. Rizzuto R, Pinton P, Carrington W, Fay FS, Fogarty KE, et al. Close Contacts with the Endoplasmic Reticulum as Determinants of Mitochondrial Ca 2+ Responses. Science. 1998:1–5. - PubMed
    1. Kuznetsov AV, Usson Y, Leverve X, Margreiter R. Subcellular heterogeneity of mitochondrial function and dysfunction: evidence obtained by confocal imaging. Molecular and cellular biochemistry. 2004;256–257:359–365. - PubMed

Publication types

MeSH terms