. 2012;7(1):e29258.
doi: 10.1371/journal.pone.0029258. Epub 2012 Jan 17.

A model for the ultrastructure of bone based on electron microscopy of ion-milled sections

Affiliations

A model for the ultrastructure of bone based on electron microscopy of ion-milled sections

Elizabeth A McNally et al. PLoS One. 2012.

Abstract

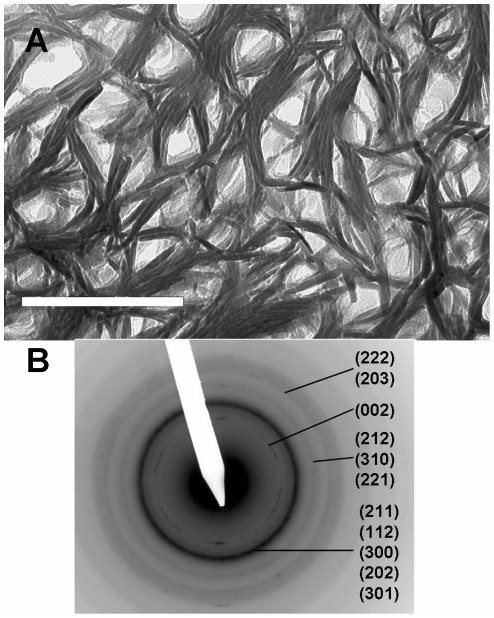
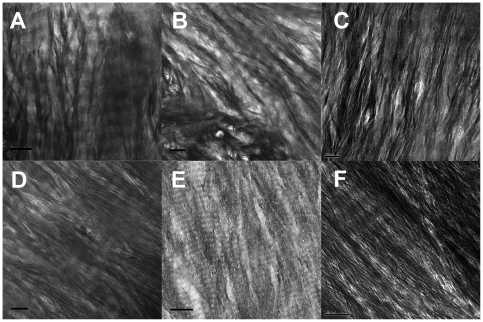
The relationship between the mineral component of bone and associated collagen has been a matter of continued dispute. We use transmission electron microscopy (TEM) of cryogenically ion milled sections of fully-mineralized cortical bone to study the spatial and topological relationship between mineral and collagen. We observe that hydroxyapatite (HA) occurs largely as elongated plate-like structures which are external to and oriented parallel to the collagen fibrils. Dark field images suggest that the structures ("mineral structures") are polycrystalline. They are approximately 5 nm thick, 70 nm wide and several hundred nm long. Using energy-dispersive X-ray analysis we show that approximately 70% of the HA occurs as mineral structures external to the fibrils. The remainder is found constrained to the gap zones. Comparative studies of other species suggest that this structural motif is ubiquitous in all vertebrates.


Conflict of interest statement

Competing Interests: The authors have declared that no competing interests exist.

Figures

Figure 1
Figure 1. Human femur sectioned parallel to long axis of femur.
a) bright field (BF) image: faint bands oriented NW-SE, repeated every 68 nm, denote concentration of HA in gap zones in collagen fibrils which run perpendicular to the bands. Perpendicular to the bands are ∼23 nm wide bundles spaced ∼50 nm apart comprised of clusters of linear features (arrow) 5±1 nm wide, and up to 200 nm in length; b) selected area diffraction pattern indexed to HA; note that 00l reflections form arcs indicating preferred orientation of the c axes of the HA parallel to the to the fibrils, while other reflections form complete circles, lack of alignment of the a and b axes.
Figure 2
Figure 2. Sharply defined borders between gap zone and overlap zone.
Bright field TEM image of longitudinal section of human bone. Image shows sharp border between high-contrast gap zones and low-contrast overlap zones. There is no evidence that the higher-contrast material (presumably HA) penetrates into the overlap zone. Arrows point to possible boundaries of constituent crystals (see Conclusions).
Figure 3
Figure 3. TEM image of cross-section of femur.
a) Bright-field image; scale bar = 100 nm. Low-contrast (light) areas surrounded by dark linear features are believed to be sections through collagen fibrils, many of which have been punctured by ion beam during ion milling; b) selected area diffraction pattern; note spotty 00l rings confirming that c-axes of HA are oriented normal to plane of section.
Figure 4
Figure 4. Dark field images.
(a) bright-field and (b) dark-field images (using 002 reflections) of same region in a sample of human bone cut parallel to the long axis of the bone. Bragg reflections from the 002 planes of HA are concentrated along the long dark structures, showing that they contain crystals of HA. Note lack of 002 reflections from gap zones. c) Dark field image of a second area showing Moiré fringes in area between lanes of mineral structures that are not visible in this image.
Figure 5
Figure 5. STEM annular dark field image and matching EDXS maps of longitudinal sections of human bone.
a) STEM image; Box outlines area shown in EDXS map, b) EDXS map of Ca distribution of area bounded by box in A. Lowest levels of Ca are over overlap zones, highest levels are over the NW-SE trending mineral structures. c) Boxes 1, 2, and 3 are areas of analysis described later in the text.
Figure 6
Figure 6. Longitudinal TEM bright field images of other bone samples.
a) femoral cortex of 19 y-old healthy male (allograft specimen) Scale = 100 nm; b) allograft remainder of 60 y-old male; scale = 100 nm; c) bovine femur; scale = 50 nm; d) elephant (mammoth [Mammuthus sp.]), c. 10,000 y old, Siberia; scale = 100 nm; e) Salmon (Oncorhynchus sp.)vertebra; scale = 300 nm; f) femur of a 6-month-old mouse (Mus musculus); scale = 100 nm.
Figure 7
Figure 7. Series of bright-field TEM images of a single section at varying orientation (tilt).
The section was initially cut at 45° to the axis of the femur, and tilted while being viewed in the electron microscope: a) tilted to −45°, showing bands of mineral structures aligned parallel to fibrils; b) tilted to +45°, showing open, lacy structure of mineral structures.
Figure 8
Figure 8. Simplified model of bone mineral and collagen fibrils in fully dense cortical bone.
Model is based on measurements from longitudinal and cross-sections of cortical bone. 45 nm-diameter collagen fibrils are shown with 40 nm-long gap zones (light) and 27 nm overlap zones (dark). Plate-like mineral structures 5 nm thick, 65 nm wide, 200 nm long tangentially surround the collagen fibrils. Mineral structures are shown stacked 4-deep between adjacent fibrils, as inferred from average inter-fibril separation and 5 nm thickness of mineral structures. A more accurate model would show mineral structures more completely surrounding each fibril (as seen in Fig. 3a).
Figure 9
Figure 9. Simplified isometric model of unit volume of bone.
The model shows the composite fibril/mineral structural makeup of cortical bone for the purpose of using EDXS data to estimate spatial distribution of mineral. The subvolumes H, G, V and O are identified in the text. EDXS X-rays are recorded emerging from top of this structure.
Figure 10
Figure 10. Comparison of sections produced by ultramicrotoming and ion milling.
a) longitudinal section of bovine femur, scale = 100 nm; b) ion-milled section of same sample in same orientation, scale = 50 nm; c) ultramicrotomed cross-section of same bone, scale = 50 nm; d) ion-milled section of sample in same orientation, scale = 50 nm.

Similar articles

Cited by

References

    1. Robinson RA, Watson ML. Collagen-crystal relationships in bone as seen in the electron microscope. Anatom Rec. 1952;114:383–409. - PubMed
    1. Arsenault LA. A comparative electron microscopic study of apatite crystals in collagen fibrils of rat bone, dentin and calcified turkey leg tendons. Bone Miner. 1989;6:165–177. - PubMed
    1. Landis WJ, Hodgens KJ, Arena J, Song MJ, McEwen BF. Structural relations between collagen and mineral in bone as determined by high voltage electron microscopic tomography. Microsc Res Tech. 1996;33:192–202. - PubMed
    1. McEwan B, Song MJ, Landis WJ. Quantitative determination of the mineral distribution in different collagen zones of calcifying tendon using high voltage electron microscopic tomography. J Comput Assist Microsc. 1992;3:201–210. - PubMed
    1. Siperko LM, Landis WJ. Aspects of mineral structure in normally calcifying avian tendon. J Struct Biol. 2001;135:313–320. - PubMed

Publication types