

Manifold learning for human population structure studies
- PMID: 22272259
- PMCID: PMC3260176
- DOI: 10.1371/journal.pone.0029901
Manifold learning for human population structure studies
Abstract
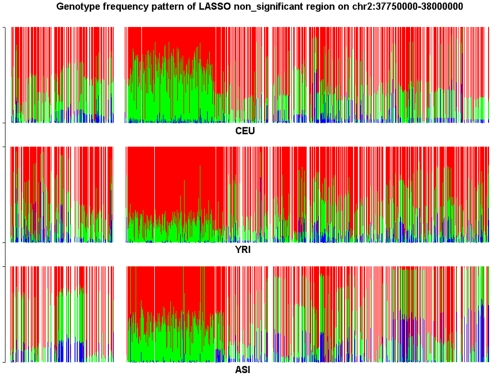
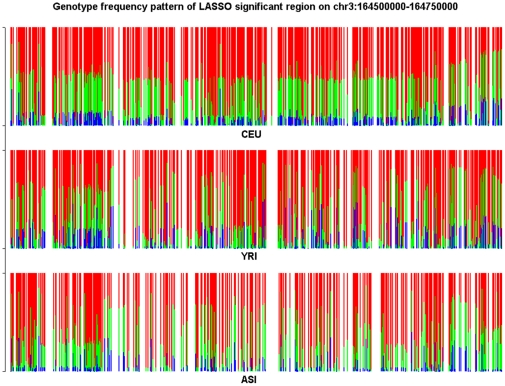
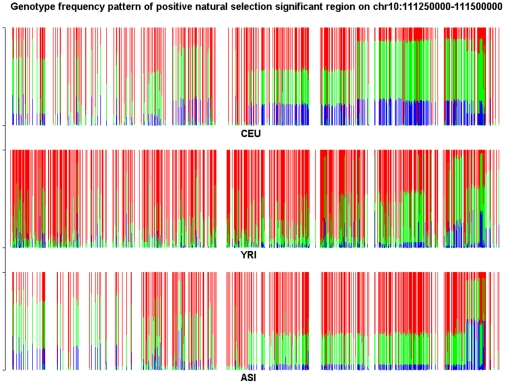
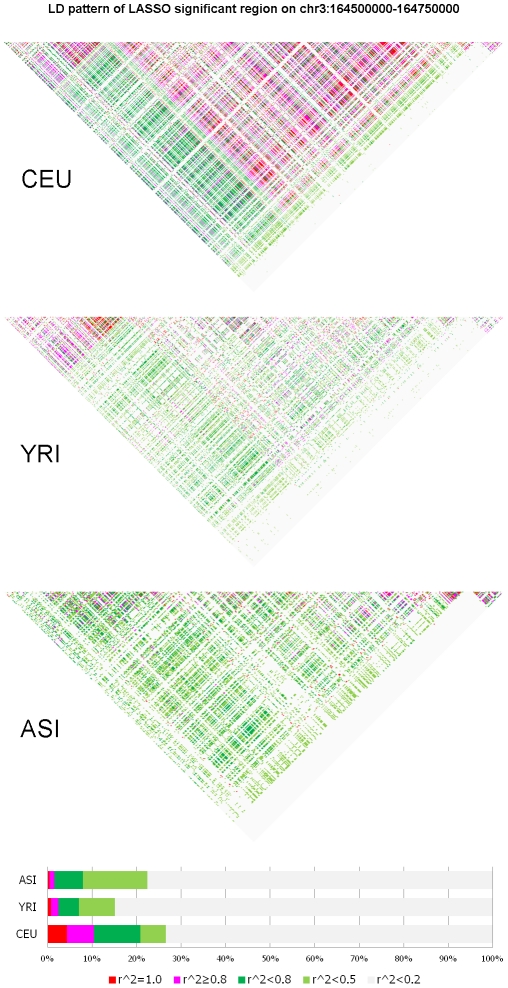
The dimension of the population genetics data produced by next-generation sequencing platforms is extremely high. However, the "intrinsic dimensionality" of sequence data, which determines the structure of populations, is much lower. This motivates us to use locally linear embedding (LLE) which projects high dimensional genomic data into low dimensional, neighborhood preserving embedding, as a general framework for population structure and historical inference. To facilitate application of the LLE to population genetic analysis, we systematically investigate several important properties of the LLE and reveal the connection between the LLE and principal component analysis (PCA). Identifying a set of markers and genomic regions which could be used for population structure analysis will provide invaluable information for population genetics and association studies. In addition to identifying the LLE-correlated or PCA-correlated structure informative marker, we have developed a new statistic that integrates genomic information content in a genomic region for collectively studying its association with the population structure and LASSO algorithm to search such regions across the genomes. We applied the developed methodologies to a low coverage pilot dataset in the 1000 Genomes Project and a PHASE III Mexico dataset of the HapMap. We observed that 25.1%, 44.9% and 21.4% of the common variants and 89.2%, 92.4% and 75.1% of the rare variants were the LLE-correlated markers in CEU, YRI and ASI, respectively. This showed that rare variants, which are often private to specific populations, have much higher power to identify population substructure than common variants. The preliminary results demonstrated that next generation sequencing offers a rich resources and LLE provide a powerful tool for population structure analysis.
Conflict of interest statement
Figures


 and illustrated by colors.
Similar articles
-
A map of human genome variation from population-scale sequencing.Nature. 2010 Oct 28;467(7319):1061-73. doi: 10.1038/nature09534. Nature. 2010. PMID: 20981092 Free PMC article.
-
Comprehensive evaluation of imputation performance in African Americans.J Hum Genet. 2012 Jul;57(7):411-21. doi: 10.1038/jhg.2012.43. Epub 2012 May 31. J Hum Genet. 2012. PMID: 22648186 Free PMC article.
-
MI-MAAP: marker informativeness for multi-ancestry admixed populations.BMC Bioinformatics. 2020 Apr 3;21(1):131. doi: 10.1186/s12859-020-3462-5. BMC Bioinformatics. 2020. PMID: 32245404 Free PMC article.
-
A review of UMAP in population genetics.J Hum Genet. 2021 Jan;66(1):85-91. doi: 10.1038/s10038-020-00851-4. Epub 2020 Oct 14. J Hum Genet. 2021. PMID: 33057159 Free PMC article. Review.
-
Genomic Analysis in the Age of Human Genome Sequencing.Cell. 2019 Mar 21;177(1):70-84. doi: 10.1016/j.cell.2019.02.032. Cell. 2019. PMID: 30901550 Free PMC article. Review.
Cited by
-
Race, common genetic variation, and therapeutic response disparities in heart failure.JACC Heart Fail. 2014 Dec;2(6):561-72. doi: 10.1016/j.jchf.2014.06.010. Epub 2014 Oct 22. JACC Heart Fail. 2014. PMID: 25443111 Free PMC article. Review.
-
Adjustment for population stratification via principal components in association analysis of rare variants.Genet Epidemiol. 2013 Jan;37(1):99-109. doi: 10.1002/gepi.21691. Epub 2012 Oct 12. Genet Epidemiol. 2013. PMID: 23065775 Free PMC article.
-
On rare variants in principal component analysis of population stratification.BMC Genet. 2020 Mar 17;21(1):34. doi: 10.1186/s12863-020-0833-x. BMC Genet. 2020. PMID: 32183706 Free PMC article.
-
Adjusting for population stratification in a fine scale with principal components and sequencing data.Genet Epidemiol. 2013 Dec;37(8):787-801. doi: 10.1002/gepi.21764. Epub 2013 Oct 5. Genet Epidemiol. 2013. PMID: 24123217 Free PMC article.
-
Adjusting for population stratification and relatedness with sequencing data.BMC Proc. 2014 Jun 17;8(Suppl 1 Genetic Analysis Workshop 18Vanessa Olmo):S42. doi: 10.1186/1753-6561-8-S1-S42. eCollection 2014. BMC Proc. 2014. PMID: 25519386 Free PMC article.
References
-
- Shendure J, Ji H. Next-generation DNA sequencing. Nat Biotechnol. 2008;26:1135–1145. - PubMed
-
- Drmanac R, Sparks AB, Callow MJ, Halpern AL, Fernandez A, et al. Human genome sequencing using unchained base reads on self-assembling DNA nanoarrays. Science. 2009;327:78–81. - PubMed
-
- Menozzi P, Piazza A, Cavalli-Sforza L. Synthetic maps of human gene frequencies in europeans. Science. 1978;201:786–792. - PubMed
Publication types
MeSH terms
Grants and funding
LinkOut - more resources
Full Text Sources
