. 2012;7(1):e29985.
doi: 10.1371/journal.pone.0029985. Epub 2012 Jan 17.

PGC-1α induces mitochondrial and myokine transcriptional programs and lipid droplet and glycogen accumulation in cultured human skeletal muscle cells

Affiliations

PGC-1α induces mitochondrial and myokine transcriptional programs and lipid droplet and glycogen accumulation in cultured human skeletal muscle cells

Emma Mormeneo et al. PLoS One. 2012.

Abstract

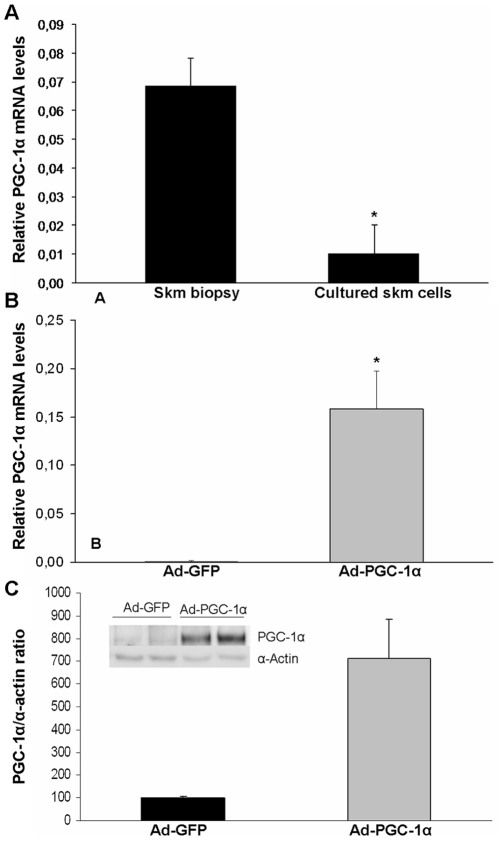
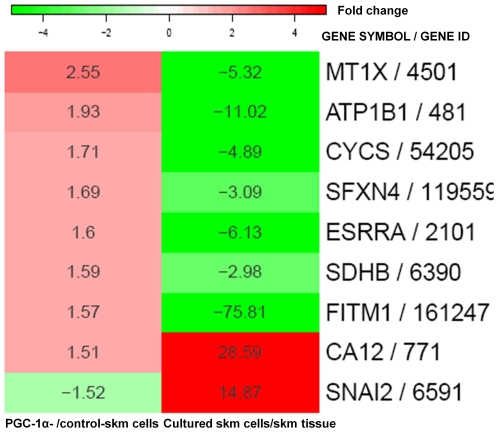
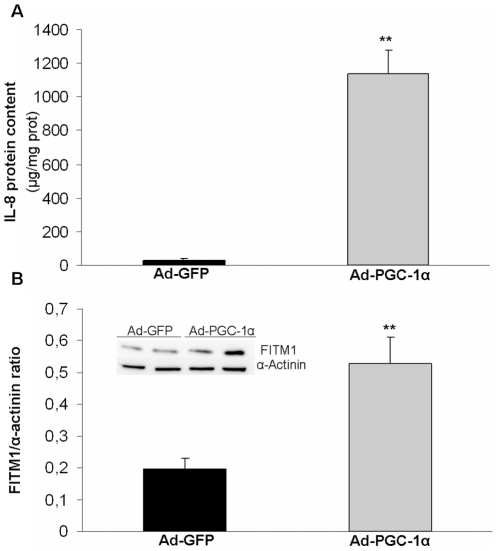
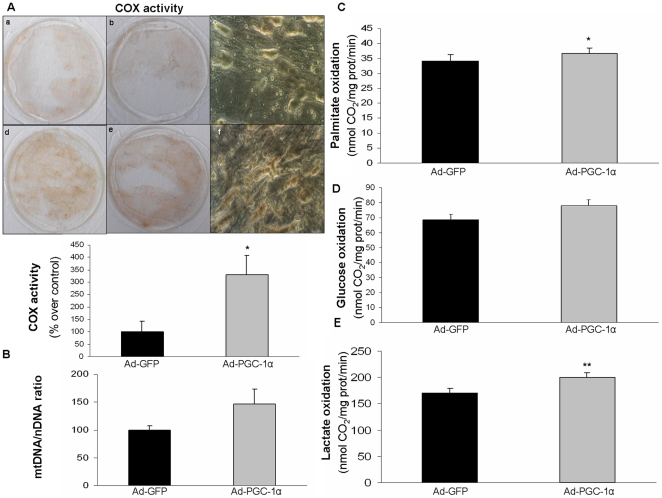
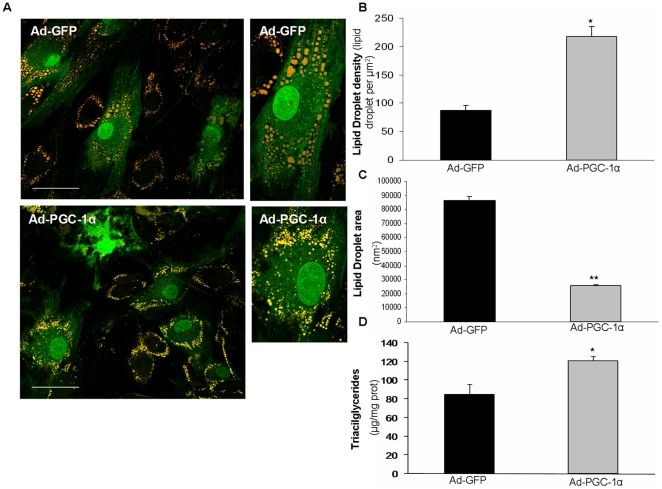
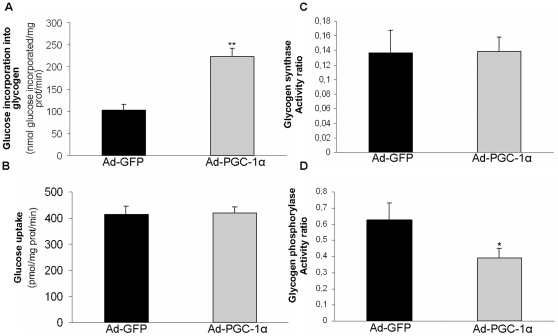
The transcriptional coactivator peroxisome proliferator-activated receptor-gamma coactivator 1 alpha (PGC-1α) is a chief activator of mitochondrial and metabolic programs and protects against atrophy in skeletal muscle (skm). Here we tested whether PGC-1α overexpression could restructure the transcriptome and metabolism of primary cultured human skm cells, which display a phenotype that resembles the atrophic phenotype. An oligonucleotide microarray analysis was used to reveal the effects of PGC-1α on the whole transcriptome. Fifty-three different genes showed altered expression in response to PGC-1α: 42 upregulated and 11 downregulated. The main gene ontologies (GO) associated with the upregulated genes were mitochondrial components and processes and this was linked with an increase in COX activity, an indicator of mitochondrial content. Furthermore, PGC-1α enhanced mitochondrial oxidation of palmitate and lactate to CO(2), but not glucose oxidation. The other most significantly associated GOs for the upregulated genes were chemotaxis and cytokine activity, and several cytokines, including IL-8/CXCL8, CXCL6, CCL5 and CCL8, were within the most highly induced genes. Indeed, PGC-1α highly increased IL-8 cell protein content. The most upregulated gene was PVALB, which is related to calcium signaling. Potential metabolic regulators of fatty acid and glucose storage were among mainly regulated genes. The mRNA and protein level of FITM1/FIT1, which enhances the formation of lipid droplets, was raised by PGC-1α, while in oleate-incubated cells PGC-1α increased the number of smaller lipid droplets and modestly triglyceride levels, compared to controls. CALM1, the calcium-modulated δ subunit of phosphorylase kinase, was downregulated by PGC-1α, while glycogen phosphorylase was inactivated and glycogen storage was increased by PGC-1α. In conclusion, of the metabolic transcriptome deficiencies of cultured skm cells, PGC-1α rescued the expression of genes encoding mitochondrial proteins and FITM1. Several myokine genes, including IL-8 and CCL5, which are known to be constitutively expressed in human skm cells, were induced by PGC-1α.


Conflict of interest statement

Competing Interests: The authors have declared that no competing interests exist.

Figures

Figure 1
Figure 1. PGC-1α gene expression.
(A,B) Human PGC-1α mRNA levels were determined relative to B2M using RT and real-time PCR. (A) Six samples were analyzed, three from cultured skm cells and three from skm biopsies. Data are expressed as mean values ± SEM of 2−ΔCt. The significance of the difference is *p<0.05. (B) Cultured skm cells were transduced with Ad-GFP or Ad-PGC-1α. Data are expressed as mean values ± SEM of 2−ΔCt for three experiments performed in triplicate. The significance of the difference is *p<0.001. (C) Cultured skm cells were transduced with Ad-GFP or Ad-PGC-1α. Immunoblot analyses were performed on nuclear cell extracts (30 µg protein) and membranes were hybridized with antibodies against PGC-1α and α-actin. A representative image is shown. Bands were quantified with ImageQuant LAS 4000. Data are means ± SEM from two experiments performed in triplicate. Significance of differences versus cells treated with Ad-GFP: *p<0.05.
Figure 2
Figure 2. Genes regulated by both PGC-1α-overexpression in cultured skm cells and skm cultures in comparison to skm tissue.
Heat map including the genes (Gene symbol/Gene ID for Entrez Gene) in Table 1 (PGC-1α- versus control-skm cells) that were also found to be differentially expressed after human skm culture according to Table S2 from (cultured skm cells versus skm tissue). Each cell displays the absolute fold change in the corresponding comparison and is filled according to the color gradient shown at the top (green and red for down and upregulated genes, respectively).
Figure 3
Figure 3. Upregulation of IL-8 and FITM1 protein content by PGC-1α-overexpression in cultured skm cells.
Cultured skm cells were transduced with Ad-GFP or Ad-PGC-1α. In cell extracts, (A) ELISA assay for IL-8 and (B) immunoblot analysis of FITM1 were performed. (B) For FITM1, α-actinin was used as loading control; a representative image is shown and bands were quantified. (A and B) Data are means ± SEM from three experiments performed in triplicate. Significance of differences versus cells treated with Ad-GFP: *p<0.05.
Figure 4
Figure 4. Effect of PGC-1α-overexpression on mitochondrial COX activity, mitochondrial to nuclear DNA ratio and oxidation of metabolic substrates in cultured muscle cells.
Cultured muscle cells were transduced with Ad-GFP or Ad-PGC-1α adenoviruses. (A) Cytochemical staining of COX activity was performed in cultured skm cells that had been transduced with Ad-GFP (a, b and c) or Ad-PGC-1α (d, e and f). Images were obtained with a camera (a,b,d,e) or with an inverted microscope at 800× magnification (c,f). Images from two independent experiments performed in duplicate were quantitatively analyzed and the data expressed as percentages of the values in the controls: means ± SEM are shown on the graph. The significance of the difference is *p<0.005. (B) Cells were harvested and total DNA isolated to measure the ratio of mitochondrial DNA (mtDNA) content to nuclear DNA (nDNA) content. Data are expressed as a percentage of control. Data are means ± SEM from two experiments performed in triplicate. (C–E) Cells were then incubated for 4 h with: (C) 0.5 mM [1-14C]-palmitate (2.8 µCi/µmol), (D) 10 mM [U-14C]-glucose (0.21 µCi/µmol) and (E) 2 mM [U-14C]-lactate (0.6 µCi/µmol). Production of 14CO2 was subsequently quantified. Data are expressed as means ± SEM from two experiments performed in sextuplicate. The significance of the difference is *p<0.005 and **p<0.001.
Figure 5
Figure 5. Effect of PGC-1α-overexpression on lipid droplets and triglyceride accumulation in cultured muscle cells.
Cultured skm cells were transduced with Ad-GFP or Ad-PGC-1α and incubated with 0.5 mM oleate for 16 h. (A,B,C) Cells were fixed and then stained with Nile Red. (A) Representative lipid droplet micrographs obtained via confocal microscopy are shown. White bars represent 5 µm. (B) The number of lipid droplets per cell area and (C) the lipid droplet mean area values were quantified. Data are means ± SEM of (B) four cells or (C) at least 414 droplets. (D) Triglyceride content was measured. Data are means ± SEM of three experiments performed in quadruplicate. (B,C,D) The significance of the differences versus cells treated with Ad-GFP is *p<0.05 and **p<0.01.
Figure 6
Figure 6. Effect of PGC-1α-overexpression on glycogen metabolism and glucose uptake in cultured muscle cells.
Cultured skm cells were transduced with Ad-GFP or Ad-PGC-1α. (A) Cells were incubated with 10 mM [U-14C]-glucose (0.10 µCi/µmol) for 18 h and then harvested to asses glucose incorporation into glycogen. Data are means ± SEM from two experiments performed in triplicate. (B) Glucose uptake was measured using 0.5 mM 2-deoxy-D-[3H]glucose (0.5 µCi/well). Data are means ± SEM from two experiments performed in triplicate. (C,D) Cells were harvested to measure (C) glycogen synthase and (D) glycogen phosphorylase activity. Data are means ± SEM from three experiments performed in quadruplicate. The significance of differences versus cells treated with control adenoviruses is indicated as follows: *p<0.05 and **p<0.01.

References

    1. Puigserver P, Spiegelman BM. Peroxisome proliferator-activated receptor-gamma coactivator 1 alpha (PGC-1 alpha): transcriptional coactivator and metabolic regulator. Endocr Rev. 2003;24:78–90. - PubMed
    1. Lin JD. Minireview: the PGC-1 coactivator networks: chromatin-remodeling and mitochondrial energy metabolism. Mol Endocrinol. 2009;23:2–10. - PMC - PubMed
    1. Arany Z. PGC-1 coactivators and skeletal muscle adaptations in health and disease. Curr Opin Genet Dev. 2008;18:426–434. - PMC - PubMed
    1. Olesen J, Kiilerich K, Pilegaard H. PGC-1alpha-mediated adaptations in skeletal muscle. Pflugers Arch. 2010;460:153–162. - PubMed
    1. Lin J, Wu H, Tarr PT, Zhang CY, Wu Z, et al. Transcriptional co-activator PGC-1 alpha drives the formation of slow-twitch muscle fibres. Nature. 2002;418:797–801. - PubMed

Publication types

MeSH terms

Associated data