. 2012;7(1):e30121.
doi: 10.1371/journal.pone.0030121. Epub 2012 Jan 17.

Gibberellin and auxin influence the diurnal transcription pattern of photoreceptor genes via CRY1a in tomato

Affiliations

Gibberellin and auxin influence the diurnal transcription pattern of photoreceptor genes via CRY1a in tomato

Paolo Facella et al. PLoS One. 2012.

Abstract

Background: Plant photoreceptors, phytochromes and cryptochromes, regulate many aspects of development and growth, such as seed germination, stem elongation, seedling de-etiolation, cotyledon opening, flower induction and circadian rhythms. There are several pieces of evidence of interaction between photoreceptors and phyto-hormones in all of these physiological processes, but little is known about molecular and genetic mechanisms underlying hormone-photoreceptor crosstalk.

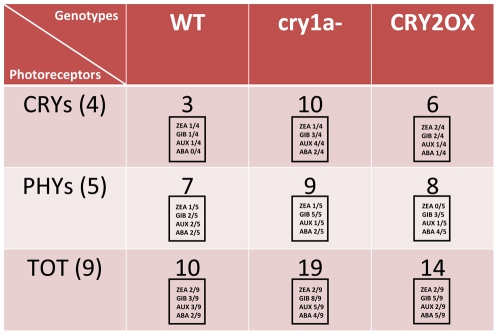
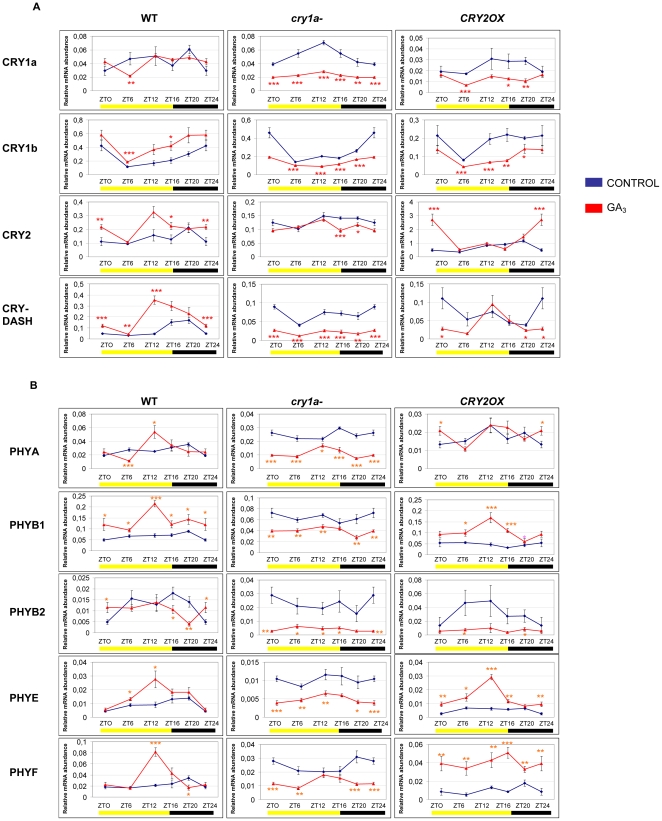
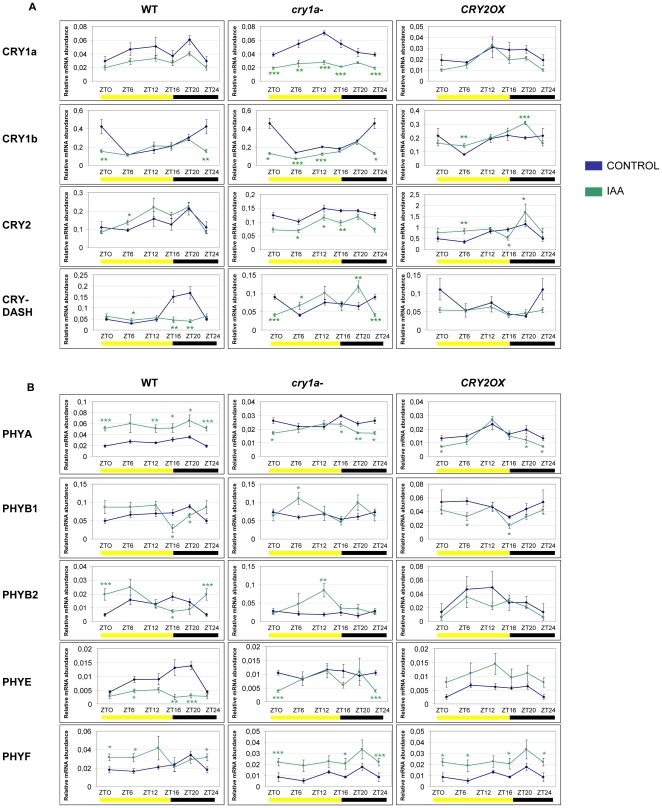
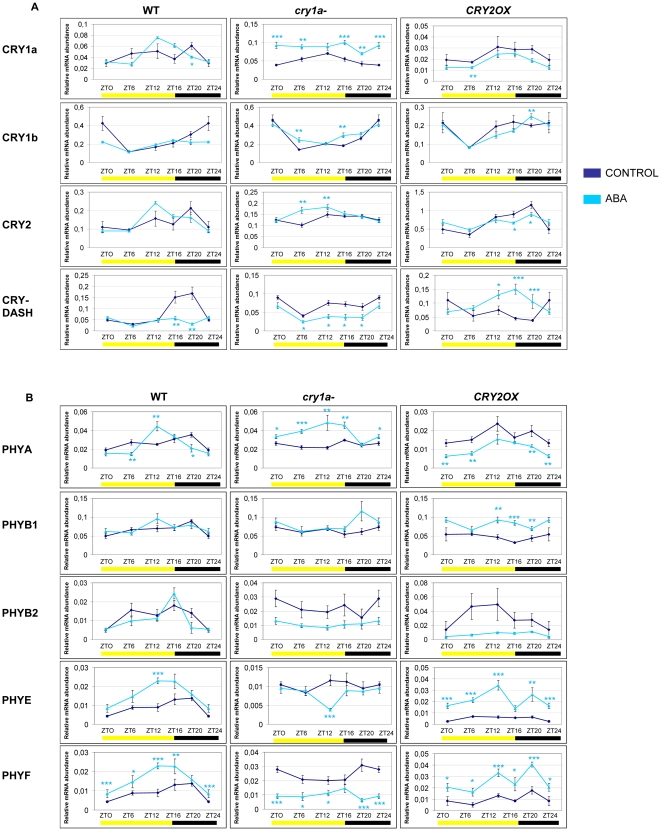
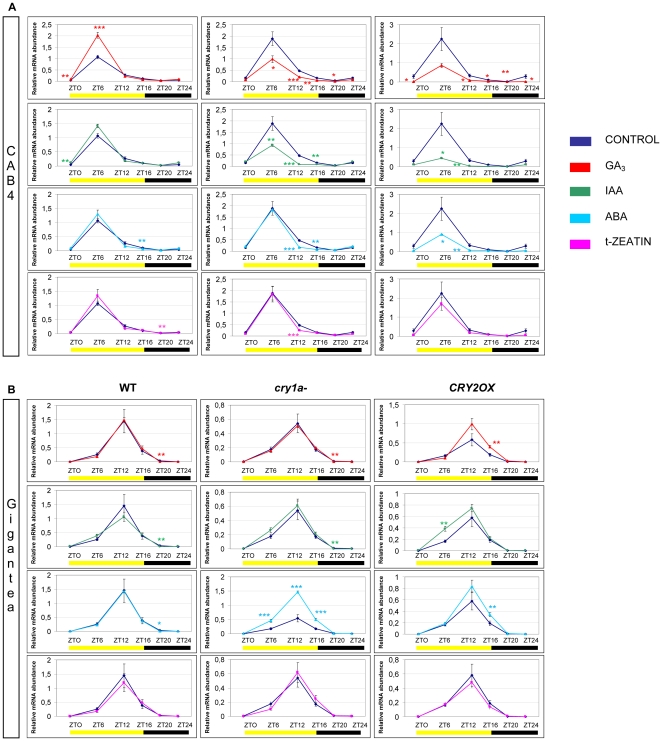
Methodology/principal findings: In this work, we investigated the molecular effects of exogenous phyto-hormones to photoreceptor gene transcripts of tomato wt, as well as transgenic and mutant lines with altered cryptochromes, by monitoring day/night transcript oscillations. GA and auxin alter the diurnal expression level of different photoreceptor genes in tomato, especially in mutants that lack a working form of cryptochrome 1a: in those mutants the expression of some (IAA) or most (GA) photoreceptor genes is down regulated by these hormones.

Conclusions/significance: Our results highlight the presence of molecular relationships among cryptochrome 1a protein, hormones, and photoreceptors' gene expression in tomato, suggesting that manipulation of cryptochromes could represent a good strategy to understand in greater depth the role of phyto-hormones in the plant photoperceptive mechanism.


Conflict of interest statement

Competing Interests: The authors have declared that no competing interests exist.

Figures

Figure 1
Figure 1. Number of transcription patterns altered in at least three points per cycle, by ZEA, GIB, AUX and ABA phyto-hormones in wt, cry1a- and CRY2OX genotypes.
We considered four cryptochrome (CRYs (4)) and five phytochrome (PHYs (5)) gene transcripts. In the squares is indicated the number of altered patterns for each hormone.
Figure 2
Figure 2. Diurnal expression pattern of Cryptochrome (A) and Phytochrome (B) transcripts analyzed by QRT-PCR in wt, cry1a- and CRY2OX GA3-treated tomato plants.
Results are presented as a ratio after normalization with β-actin. Yellow and dark bars along the horizontal axis represent light and dark periods, respectively. Time points are measured in hours from dawn (zeitgeber Time [ZT]); data at ZT24 constitute a replotting of those at ZT0. The control data, of gene expression in the absence of hormone applications, are reproduced, for clarity, from those in Figure S1. Data shown are the average of two biological replicates, with error bars representing SEM. Hormone-treated plant transcripts significantly different from the corresponding ones of control plants are marked with a * (Student's t test, P≤0.05), two ** (Student's t test, P≤0.01) and three *** (Student's t test, P≤0.001).
Figure 3
Figure 3. Diurnal expression pattern of Cryptochrome (A) and Phytochrome (B) transcripts analyzed by QRT-PCR in wt, cry1a- and CRY2OX IAA-treated tomato plants.
Results are presented as a ratio after normalization with β-actin. Yellow and dark bars along the horizontal axis represent light and dark periods, respectively. Time points are measured in hours from dawn (zeitgeber Time [ZT]); data at ZT24 constitute a replotting of those at ZT0. The control data, of gene expression in the absence of hormone applications, are reproduced, for clarity, from those in Figure S1. Data shown are the average of two biological replicates, with error bars representing SEM. Hormone-treated plant transcripts significantly different from the corresponding ones of control plants are marked with a * (Student's t test, P≤0.05), two ** (Student's t test, P≤0.01) and three *** (Student's t test, P≤0.001). Data from control plants are replotted from Figure 2.
Figure 4
Figure 4. Diurnal expression pattern of Cryptochrome (A) and Phytochrome (B) transcripts analyzed by QRT-PCR in wt, cry1a- and CRY2OX ABA-treated tomato plants.
Results are presented as a ratio after normalization with β-actin. Yellow and dark bars along the horizontal axis represent light and dark periods, respectively. Time points are measured in hours from dawn (zeitgeber Time [ZT]); data at ZT24 constitute a replotting of those at ZT0. The control data, of gene expression in the absence of hormone applications, are reproduced, for clarity, from those in Figure S1. Data shown are the average of two biological replicates, with error bars representing SEM. Hormone-treated plant transcripts significantly different from the corresponding ones of control plants are marked with a * (Student's t test, P≤0.05), two ** (Student's t test, P≤0.01) and three *** (Student's t test, P≤0.001). Data from control plants are replotted from Figure 2.
Figure 5
Figure 5. Diurnal expression pattern of CAB4 (A) and GIGANTEA (B) transcripts analyzed by QRT-PCR in wt, cry1a- and CRY2OX hormone-treated tomato plants.
Results are presented as a ratio after normalization with β-actin. Yellow and dark bars along the horizontal axis represent light and dark periods, respectively. Time points are measured in hours from dawn (zeitgeber Time [ZT]); data at ZT24 constitute a replotting of those at ZT0. The control data, of gene expression in the absence of hormone applications, are reproduced, for clarity, from those in Figure S1. Data shown are the average of two biological replicates, with error bars representing SEM. Hormone-treated plant transcripts significantly different from the corresponding ones of control plants are marked with a * (Student's t test, P≤0.05), two ** (Student's t test, P≤0.01) and three *** (Student's t test, P≤0.001).

Similar articles

Cited by

References

    1. Ogawa M, Hanada A, Yamauchi Y, Kuwahara A, Kamiya Y, et al. Gibberellin biosynthesis and response during Arabidopsis seed germination (vol 15, pg 1591, 2003). Plant Cell. 2004;16:783–783. - PMC - PubMed
    1. Penfield S, Hall A. A Role for Multiple Circadian Clock Genes in the Response to Signals That Break Seed Dormancy in Arabidopsis. Plant Cell. 2009;21:1722–1732. - PMC - PubMed
    1. Sakai T, Nagashima A, Uehara Y. The ABC subfamily B auxin transporter AtABCB19 is involved in the inhibitory effects of N-1-Naphthyphthalamic acid on the phototropic and gravitropic responses of Arabidopsis hypocotyls. Plant and Cell Physiology. 2008;49:1250–1255. - PubMed
    1. Deng XW, Feng SH, Martinez C, Gusmaroli G, Wang Y, et al. Coordinated regulation of Arabidopsis thaliana development by light and gibberellins. Nature. 2008;451:475–U479. - PMC - PubMed
    1. Zhao X, Yu X, Foo E, Symons GM, Lopez J, et al. A study of gibberellin homeostasis and cryptochrome-mediated blue light inhibition of hypocotyl elongation. Plant Physiol. 2007;145:106–118. - PMC - PubMed

Publication types

MeSH terms