. 2012;7(1):e30130.
doi: 10.1371/journal.pone.0030130. Epub 2012 Jan 17.

The scaffolding protein Dlg1 is a negative regulator of cell-free virus infectivity but not of cell-to-cell HIV-1 transmission in T cells

Affiliations

The scaffolding protein Dlg1 is a negative regulator of cell-free virus infectivity but not of cell-to-cell HIV-1 transmission in T cells

Patrycja Nzounza et al. PLoS One. 2012.

Abstract

Background: Cell-to-cell virus transmission of Human immunodeficiency virus type-1 (HIV-1) is predominantly mediated by cellular structures such as the virological synapse (VS). The VS formed between an HIV-1-infected T cell and a target T cell shares features with the immunological synapse (IS). We have previously identified the human homologue of the Drosophila Discs Large (Dlg1) protein as a new cellular partner for the HIV-1 Gag protein and a negative regulator of HIV-1 infectivity. Dlg1, a scaffolding protein plays a key role in clustering protein complexes in the plasma membrane at cellular contacts. It is implicated in IS formation and T cell signaling, but its role in HIV-1 cell-to-cell transmission was not studied before.

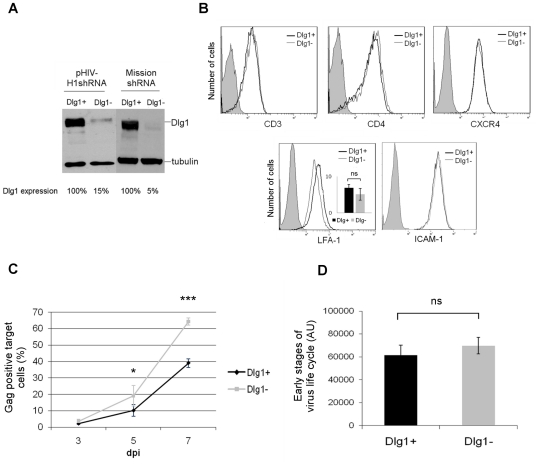
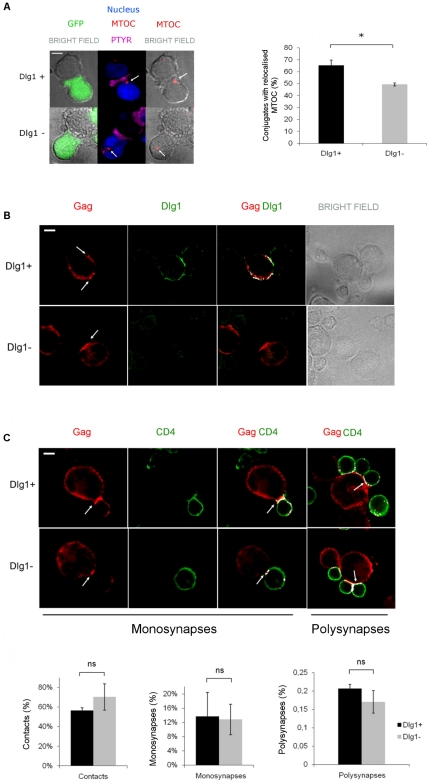
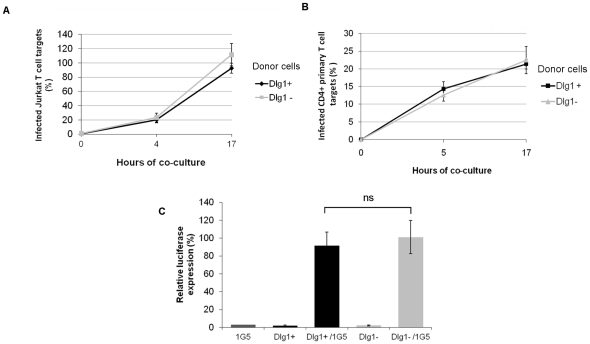
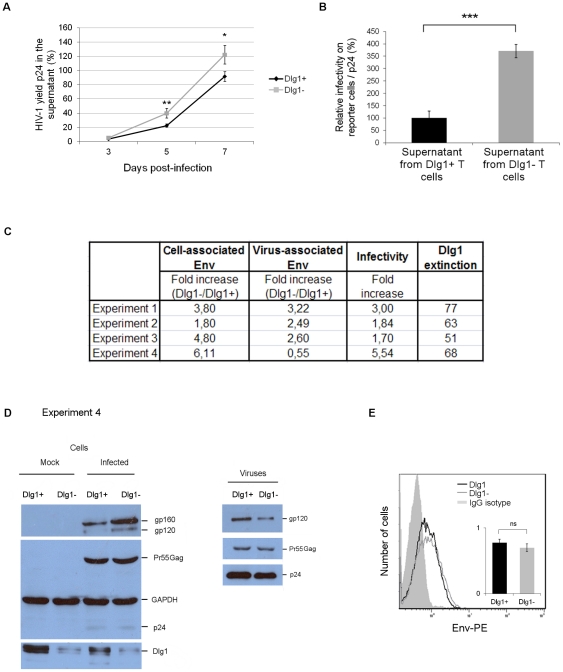
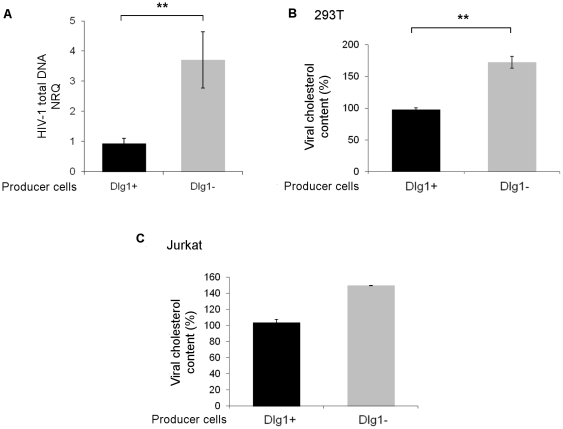
Methodology/principal findings: Kinetics of HIV-1 infection in Dlg1-depleted Jurkat T cells show that Dlg1 modulates the replication of HIV-1. Single-cycle infectivity tests show that this modulation does not take place during early steps of the HIV-1 life cycle. Immunofluorescence studies of Dlg1-depleted Jurkat T cells show that while Dlg1 depletion affects IS formation, it does not affect HIV-1-induced VS formation. Co-culture assays and quantitative cell-to-cell HIV-1 transfer analyses show that Dlg1 depletion does not modify transfer of HIV-1 material from infected to target T cells, or HIV-1 transmission leading to productive infection via cell contact. Dlg1 depletion results in increased virus yield and infectivity of the viral particles produced. Particles with increased infectivity present an increase in their cholesterol content and during the first hours of T cell infection these particles induce higher accumulation of total HIV-1 DNA.

Conclusion: Despite its role in the IS formation, Dlg1 does not affect the VS and cell-to-cell spread of HIV-1, but plays a role in HIV-1 cell-free virus transmission. We propose that the effect of Dlg1 on HIV-1 infectivity is at the stage of virus entry.


Conflict of interest statement

Competing Interests: The authors have declared that no competing interests exist.

Figures

Figure 1
Figure 1. HIV-1 replication is enhanced in Dlg1-depleted T cells.
A. Dlg1 expression in Dlg1+ and Dlg1- Jurkat T cells obtained with two lentivirus-based shRNA vectors. The stable Dlg1-depleted Jurkat T cell lines (Dlg1-) were obtained using two lentivirus-based vectors that target two different sequences on Dlg1. Control Jurkat T cell lines (Dlg1+) were obtained using the control vectors. T cells transduced with the GFP-encoding vectors (pHIV-H1shRNADlg1 or pHIV-H1shRNACtl) or with the puromycin-encoding vectors (Mission shRNADlg1 or Mission shRNA Ctl) were analyzed by western blot, and Dlg1 levels were quantified using ImageJ software. B. Expression of surface molecules in Dlg1+ and Dlg1- Jurkat T cells. Cells were labeled with antibodies against CD3, CD4, CXCR4, LFA-1 and ICAM-1 and analyzed by flow cytometry. The data are representative of three independent experiments performed in triplicates. For LFA-1 the mean values of three independent experiments performed in triplicates is also presented. C. HIV-1 replication in Dlg1+ and Dlg1- Jurkat T cells infected with the NL4.3 HIV strain. Viral replication was measured by determining the fraction of HIV-1-infected cells in the two cultures by intracellular Gag labeling and flow cytometry. Cells were labeled with the anti-HIV-p24 mAb KC57-PE, 3, 5 and 7 dpi. The data are the means of four independent experiments performed in duplicate. P = 0.031 for 5 dpi. P<0.0001 for 7 dpi. D. Efficiency of early steps of the HIV-1 life cycle in cells expressing or not Dlg1. Dlg1+ and Dlg1- Jurkat T cells were infected with the single cycle pNL4.3-derived pNluc vector pseudotyped with the HIV-1 Env expression vector pIIINL4env and luciferase activity was measured 48 h post infection. The data are the means of three independent experiments performed in triplicate, using 100 ng to 1000 ng of p24 of virus produced by 293T cells co-transfected with 5 µg of pNLuc and 0.5, 0.75 or 1 µg of pIIINL4env. P = 0.59. Error bars represent standard error of the mean (SEM). ns  =  no statistically significant difference. *, P<0.05. ***, P<0.001. AU  =  arbitrary units.
Figure 2
Figure 2. Dlg1 depletion affects IS but not VS formation in T cells.
A. MTOC polarization toward the nascent IS in Dlg1+ and Dlg1- Jurkat T cells. Left panel: IS conjugates were formed between Jurkat and APC (Raji B) cells. Phosphotyrosine accumulation at the interface between two contacting cells served as marker of a productive IS contact that led to TCR activation and to activation of the downstream signaling cascade. Centrin was visualized simultaneously to localize the MTOC. A polarized MTOC in a Dlg1+ T cell and an unpolarized MTOC in a Dlg1- T cell are seen. The nuclei of Jurkat T cells are shown in blue, the MTOCs are shown in red and indicated by a white arrow. The phosphotyrosine (PTYR) is shown in magenta. The results shown were obtained with the pHIV-H1shRNADlg1 and pHIV-H1shRNACtl vectors expressing the GFP. Similar results were obtained with cells transduced with the lentivirus vectors pHIV-H1shRNADlg1 and Mission shRNADlg1. Right panel: Quantification of MTOC polarization observed in Dlg1+ (n = 131) and Dlg1- (n = 151) T cells in four independent experiments. P = 0.029. B. Cellular localization of Gag in the presence and absence of Dlg1. Dlg1+ and Dlg1- Jurkat T cells were immunostained for Gag and for Dlg1. White arrows indicate Gag accumulation at the VS. The images shown are representative of three independent experiments. C. VS formation in Dlg1+ and Dlg1- Jurkat T cells. Upper panel: HIV-1-infected Dlg1+ and Dlg1- Jurkat T cells were mixed with an equal number of non-infected primary CD4+ target cells and were allowed to establish contacts on poly-L-lysine-coated coverslips for 1 h at 37°C. The cells were fixed, permeabilized, immunostained for Gag and CD4 and analyzed by confocal microscopy. Monosynapses were defined as contacts between a single effector and a single target cell presenting co-localization (in white) of Gag on the infected cell and of CD4 on the CD4+ target cell at sites of contact. Polysynapses were defined as contacts between a single effector cell and multiple target cells. Lower panel: Quantification of cellular contacts, monosynapses and polysynapses between HIV-1-infected Dlg1+ or Dlg1- Jurkat T cells and CD4+ target cells. A total of 1603 Dlg1+ control T cells and 1616 Dlg1- T cells were counted. The data are the means of 3 independent experiments. P = 0.7 for contacts. P = 1.0 for monosynapses. P = 1.0 for polysynapses. Error bars represent SEM. ns  =  no statistically significant difference. *, P<0.05. Scale bar  =  5 µm.
Figure 3
Figure 3. HIV-1 cell-to-cell transmission is not affected in Dlg1-depleted T cells.
A. Co-culture of HIV-1-infected Dlg1+ and Dlg1- Jurkat and target Jurkat Dlg+ T cells. Dlg1+ and Dlg1- Jurkat T cells infected with HIV-1 NL4.3 were co-cultured with target Jurkat cells. When a minimum level of 20% infection was reached for both Dlg1+ and Dlg1- cells, equal numbers of infected and target cells were mixed and co-cultured for up to 17 h. At different times after infection the cells were analyzed by flow cytometry to determine the percentage of infected target cells. Results are mean relative values of six independent experiments performed in duplicate. For each experiment the values were normalized taking as 100% the value obtained for one of the duplicates of Dlg1+ cells at 17h. P = 0.26 at 17 h. Assays were performed with cells transduced with the two lentivirus vectors (pHIV-H1shRNA and Mission shRNA) and similar results were obtained. The results obtained with the GFP-encoding vectors are presented. B. Co-culture of HIV-1-infected Dlg1+ and Dlg1- Jurkat and target CD4+ primary T cells. Dlg1+ and Dlg1- Jurkat T cells infected with HIV-1 NL4.3 were co-cultured with primary CD4+ T cells previously labeled with cell trace violet. Infected and target cells were co-cultured at a 1∶1 ratio for up to 17 h and analyzed by flow cytometry. The data are average values of three independent experiments performed in duplicate. P = 0.31. C. Co-culture of HIV-1-infected Dlg1+ and Dlg1- Jurkat and target Jurkat-LTR-luciferase T cells. Dlg1+ and Dlg1- Jurkat T cells infected with HIV-1 NL4.3 were co-cultured with Jurkat-LTR-luciferase cells (1G5 cells). Infected and target cells were co-cultured at a 1∶1 ratio for up to 24 h and analyzed for luciferase activity. The data are average relative values of three independent experiments performed in duplicate. The values were normalized taking the values obtained for 1G5 cells at 24 h as background for each experiment. P = 0.7. Error bars represent SEM. ns  =  no statistically significant difference.
Figure 4
Figure 4. The levels of HIV-1 Env incorporated into viral particles produced by Dlg1-depleted T cells do not correlate with increased infectivity.
A. HIV-1 yield of Dlg1+ and Dlg1- T cells. Supernatants were collected during the course of infection, filtered and the p24 content was measured by ELISA. The values were normalized for protein content of extracts of cultured cells. The data are the mean values of three independent experiments each carried out in duplicate. For each experiment the values were normalized taking as 100% the value obtained for one of the duplicates of Dlg1+ cells at 7 dpi. P = 0.007 for 5 dpi. P = 0.02 for 7 dpi. B. Infectivity of HIV-1 particles produced by Dlg1+ and Dlg1- T cells. Viral supernatants of Dlg1+ and Dlg1- Jurkat T cells infected with HIV-1 NL4.3 were collected 7 dpi, filtered and used to infect indicator HeLa P4.2 reporter cells. Equal amounts of virus determined by p24 quantification were used. ß-galactosidase production was assessed by a colorimetric assay based on cleavage of CPRG. The data are means of four independent experiments carried out in triplicate. P = 0.0004. C. Summary of quantification of cell-associated Env in Dlg1+ and Dlg1- cells and of virus-associated Env in progeny viruses. The cell-associated Env levels were estimated from the intensity of the signals on western blots and calculated as gp160+gp120/Gag in cell lysates. Equal amounts of total protein in lysates of Dlg1+ and Dlg1- HIV-1-infected cells recovered 5 dpi were analyzed using antibodies against HIV-1 Gag and Env. The virus-associated Env levels (gp120) were estimated from the intensity of the signals on the western blots; equal amounts of p24 of purified viruses from supernatants of Dlg1+ and Dlg1- HIV-1-infected cells were analyzed using antibodies against HIV-1 Gag and Env. The infectivity of these viruses was determined as described in B. The data are from four independent experiments. D. Western blot analysis of protein extracts of Dlg1+ and Dlg1- cells and of purified viruses produced. Results of experiment 4 are shown. Left panel: equal amounts of total protein in lysates of Dlg1+ and Dlg1- HIV-1-infected cells recovered 5 dpi were analyzed using antibodies against HIV-1 Gag and Env, against Dlg1 and against GAPDH. Right panel: equal amounts of p24 of purified viruses from supernatants of Dlg1+ and Dlg1- HIV-1-infected cells were analyzed using antibodies against HIV-1 Gag and Env. E. Cell-surface level of HIV-1 Env on Dlg1+ and Dlg1- HIV-1-infected T cells. The cell-surface level of HIV-1 Env was determined by flow cytometry analysis using the anti-Env 5F7 antibodies. HIV-1-infected Dlg1+ and Dlg1- Jurkat T cells were analyzed 5 dpi. Two independent experiments were carried out in duplicate. Error bars represent SEM. ns  =  no statistically significant difference. *, P<0.05. **, P<0.01. ***, P<0.001.
Figure 5
Figure 5. Budding of HIV-1 particles in Dlg1- Jurkat T cells occurs at the plasma membrane and in internal compartments.
A. Budding of HIV-1 particles in Dlg1- Jurkat T cells from the plasma membrane. Dlg1+ and Dlg1- Jurkat T cells infected with HIV-1 were examined 6 dpi, when infection was about 60%, by electron microscopy in cells not forced to form conjugates. A total of 320 Dlg1+ Jurkat T cells (out of 5300) showing viral particles and of 392 Dlg1- Jurkat T cells (out of 6500) showing viral particles were counted. Budding from plasma membrane was identical in Dlg1+ and Dlg1- cells; the image presented is of a Dlg1- Jurkat T cell. Two independent experiments were performed with both NL4.3 and LAI.2 HIV-1. B. Budding of HIV-1 particles in Dlg1- Jurkat T cells from internal compartments. Cells were treated as above. Budding and mature particles are seen in an internal compartment in a Dlg1- Jurkat cell. C and D. HIV-1 particles in internal compartments of Dlg1- Jurkat T cells. Mature particles are seen in the enlargement in D. E and F. HIV-1 particles in compartments near the plasma membrane of Dlg1- Jurkat T cells. Mature particles are seen in the enlargement in F. Same magnification was used in C and E and in D and F. P = 0.02 for NL4.3. P = 0.01 for LAI.2 infected cells. Scale is 0.5 µm for A, D and F, 2 µm for C and E and 100 nm for B.
Figure 6
Figure 6. HIV-1 particles produced by Dlg1-depleted cells accumulated higher total HIV-1 DNA amounts during the first hours of infection and have increased cholesterol content.
A. Quantification of total viral DNA. Total viral DNA was quantified by quantitative PCR in Jurkat T cells 6 h after infection with NL4.3 or LAI.2 HIV-1 particles produced by Dlg1+ and Dlg1- cells. The results are expressed as mean NRQ (normalized RQ described in materials and methods). Values are from one representative experiment performed in triplicate for infection and in triplicate for qPCR. P = 0.001. B. Viral cholesterol content of HIV-1 particles produced by 293T cells. Dlg1- 293T cells were obtained by siRNA transfection. The cholesterol content of LAI.2 HIV-1 produced by Dlg1+ or Dlg1- 293T cells was determined. The data are the means of three independent experiments performed in duplicate. For each experiment the values were normalized to the value obtained with one of the duplicates of viruses from Dlg1+ cells taken as 100%. P = 0.0026. C. Viral cholesterol content of HIV-1 particles produced by Jurkat T cells. Cholesterol content of LAI.2 HIV-1 produced by Dlg1+ or Dlg1- Jurkat T cells was determined. The data are the means of one experiment performed in duplicate. The values were normalized to the value obtained for one of the duplicates of viruses from Dlg1+ cells taken as 100%. Error bars represent SEM. **, P<0.01.

Similar articles

Cited by

References

    1. Chen P, Hubner W, Spinelli MA, Chen BK. Predominant mode of human immunodeficiency virus transfer between T cells is mediated by sustained Env-dependent neutralization-resistant virological synapses. J Virol. 2007;81:12582–12595. - PMC - PubMed
    1. Sourisseau M, Sol-Foulon N, Porrot F, Blanchet F, Schwartz O. Inefficient human immunodeficiency virus replication in mobile lymphocytes. J Virol. 2007;81:1000–1012. - PMC - PubMed
    1. Blanco J, Bosch B, Fernandez-Figueras MT, Barretina J, Clotet B, et al. High level of coreceptor-independent HIV transfer induced by contacts between primary CD4 T cells. J Biol Chem. 2004;279:51305–51314. - PubMed
    1. Dimitrov DS, Willey RL, Sato H, Chang LJ, Blumenthal R, et al. Quantitation of human immunodeficiency virus type 1 infection kinetics. J Virol. 1993;67:2182–2190. - PMC - PubMed
    1. Sowinski S, Jolly C, Berninghausen O, Purbhoo MA, Chauveau A, et al. Membrane nanotubes physically connect T cells over long distances presenting a novel route for HIV-1 transmission. Nat Cell Biol. 2008;10:211–219. - PubMed

Publication types

MeSH terms