

Remarkable reduction of MAP2 in the brains of scrapie-infected rodents and human prion disease possibly correlated with the increase of calpain
- PMID: 22272295
- PMCID: PMC3260227
- DOI: 10.1371/journal.pone.0030163
Remarkable reduction of MAP2 in the brains of scrapie-infected rodents and human prion disease possibly correlated with the increase of calpain
Abstract
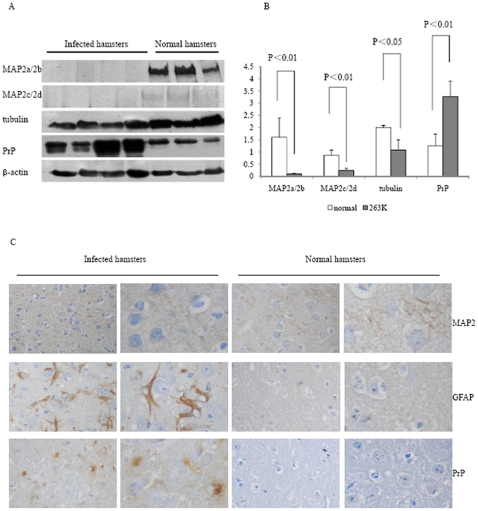
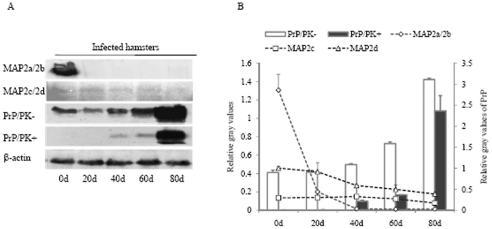
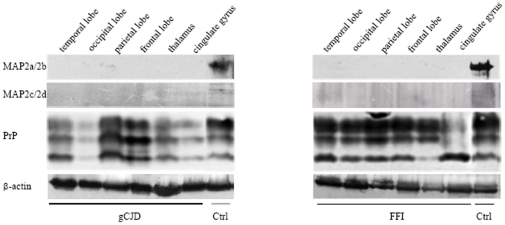
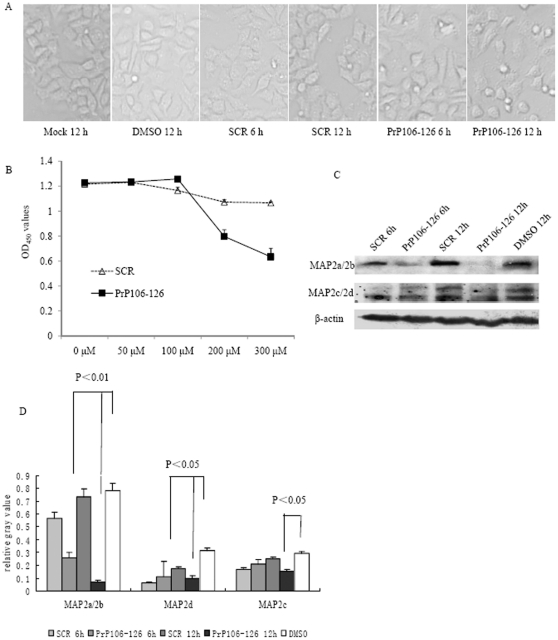
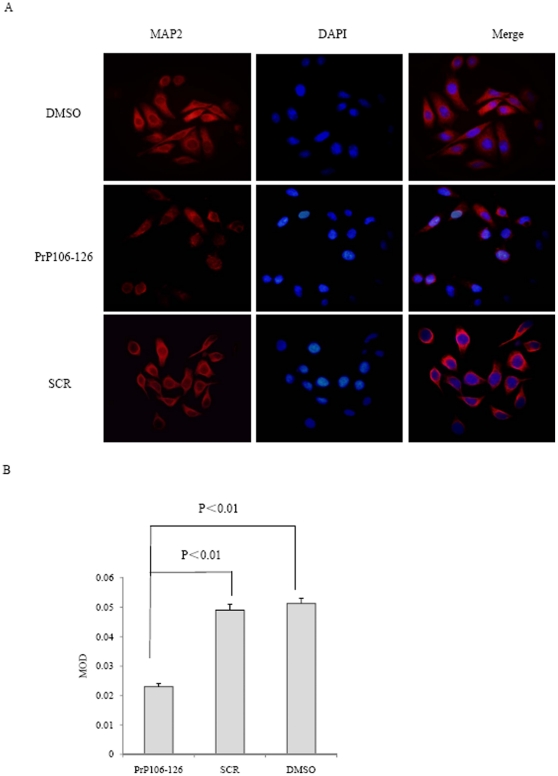
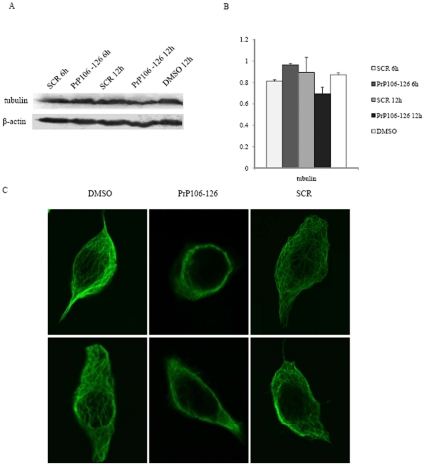
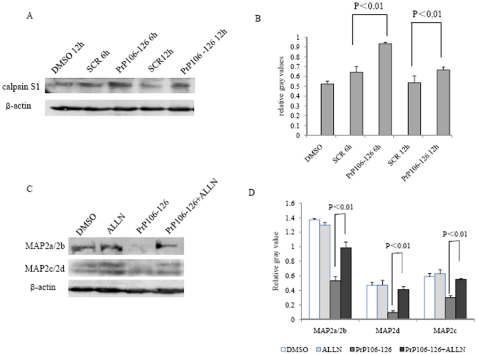
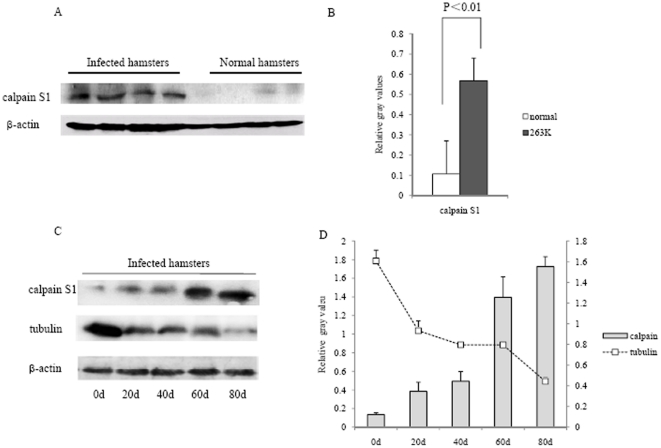
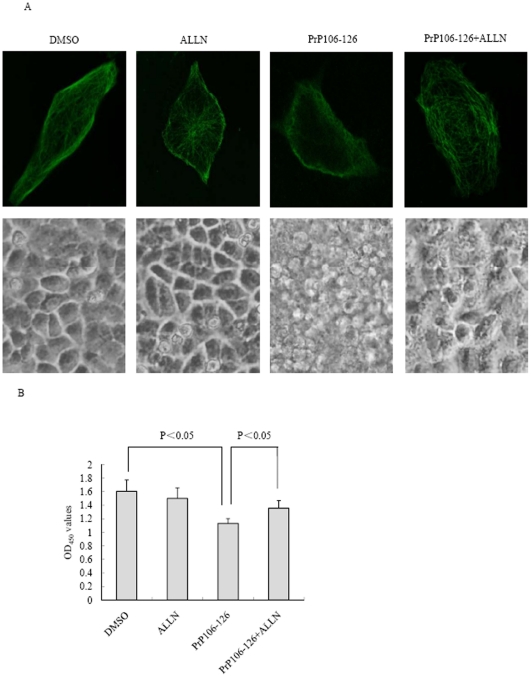
Microtubule-associated protein 2 (MAP2) belongs to the family of heat stable MAPs, which takes part in neuronal morphogenesis, maintenance of cellular architecture and internal organization, cell division and cellular processes. To obtain insight into the possible alteration and the role of MAP2 in transmissible spongiform encephalopathies (TSEs), the MAP2 levels in the brain tissues of agent 263K-infected hamsters and human prion diseases were evaluated. Western blots and IHC revealed that at the terminal stages of the diseases, MAP2 levels in the brain tissues of scrapie infected hamsters, a patient with genetic Creutzfeldt-Jakob disease (G114V gCJD) and a patient with fatal familial insomnia (FFI) were almost undetectable. The decline of MAP2 was closely related with prolonged incubation time. Exposure of SK-N-SH neuroblastoma cell line to cytotoxic PrP106-126 peptide significantly down-regulated the cellular MAP2 level and remarkably disrupted the microtubule structure, but did not alter the level of tubulin. Moreover, the levels of calpain, which mediated the degradation of a broad of cytoskeletal proteins, were significantly increased in both PrP106-126 treated SK-N-SH cells and brain tissues of 263K prion-infected hamsters. Our data indicate that the decline of MAP2 is a common phenomenon in TSEs, which seems to occur at an early stage of incubation period. Markedly increased calpain level might contribute to the reduction of MAP2.
Conflict of interest statement
Figures
Similar articles
-
Reduction of protein kinase MARK4 in the brains of experimental scrapie rodents and human prion disease correlates with deposits of PrP(Sc).Int J Mol Med. 2012 Sep;30(3):569-78. doi: 10.3892/ijmm.2012.1025. Epub 2012 Jun 12. Int J Mol Med. 2012. PMID: 22692785
-
Decrease of RyR2 in the prion infected cell line and in the brains of the scrapie infected mice models and the patients of human prion diseases.Prion. 2018;12(3-4):175-184. doi: 10.1080/19336896.2018.1465162. Epub 2018 Jun 7. Prion. 2018. PMID: 29676187 Free PMC article.
-
Different expression patterns of CK2 subunits in the brains of experimental animals and patients with transmissible spongiform encephalopathies.Arch Virol. 2008;153(6):1013-20. doi: 10.1007/s00705-008-0084-z. Epub 2008 Apr 11. Arch Virol. 2008. PMID: 18404245
-
Prion encephalopathies of animals and humans.Dev Biol Stand. 1993;80:31-44. Dev Biol Stand. 1993. PMID: 8270114 Review.
-
Human transmissible spongiform encephalopathies: historic view.Handb Clin Neurol. 2018;153:1-17. doi: 10.1016/B978-0-444-63945-5.00001-5. Handb Clin Neurol. 2018. PMID: 29887130 Review.
Cited by
-
Gene and protein patterns of potential prion-related markers in the central nervous system of clinical and preclinical infected sheep.Vet Res. 2013 Mar 11;44(1):14. doi: 10.1186/1297-9716-44-14. Vet Res. 2013. PMID: 23497022 Free PMC article.
-
Functionally specific binding regions of microtubule-associated protein 2c exhibit distinct conformations and dynamics.J Biol Chem. 2018 Aug 24;293(34):13297-13309. doi: 10.1074/jbc.RA118.001769. Epub 2018 Jun 20. J Biol Chem. 2018. PMID: 29925592 Free PMC article.
-
Extensive Disturbances of Intracellular Components and Dysfunctions of Biological Pathways in the Brain Tissues During Prion Infection - China's Studies.China CDC Wkly. 2022 Aug 19;4(33):741-747. doi: 10.46234/ccdcw2022.154. China CDC Wkly. 2022. PMID: 36285114 Free PMC article. Review.
-
Activation of the macroautophagic system in scrapie-infected experimental animals and human genetic prion diseases.Autophagy. 2012 Nov;8(11):1604-20. doi: 10.4161/auto.21482. Epub 2012 Aug 9. Autophagy. 2012. PMID: 22874564 Free PMC article.
-
More than a marker: potential pathogenic functions of MAP2.Front Mol Neurosci. 2022 Sep 16;15:974890. doi: 10.3389/fnmol.2022.974890. eCollection 2022. Front Mol Neurosci. 2022. PMID: 36187353 Free PMC article.
References
-
- Collinge J. Prion diseases of humans and animals: their causes and molecular basis. Annu Rev Neurosci. 2001;24:519–550. - PubMed
-
- Legname G, Baskakov IV, Nguyen HO, Riesner D, Cohen FE, et al. Synthetic mammalian prions. Science. 2004;305:673–676. - PubMed
-
- Forloni G, Angeretti N, Chiesa R, Monzani E, Salmona M, et al. Neurotoxicity of a prion protein fragment. Nature. 1993;362:543–546. - PubMed
-
- Seo JS, Moon MH, Jeong JK, Seol JW, Lee YJ, et al. SIRT1, a histone deacetylase, regulates prion protein-induced neuronal cell death. Neurobiol Aging 2010 - PubMed
Publication types
MeSH terms
Substances
LinkOut - more resources
Full Text Sources
