

A MusD retrotransposon insertion in the mouse Slc6a5 gene causes alterations in neuromuscular junction maturation and behavioral phenotypes
- PMID: 22272310
- PMCID: PMC3260239
- DOI: 10.1371/journal.pone.0030217
A MusD retrotransposon insertion in the mouse Slc6a5 gene causes alterations in neuromuscular junction maturation and behavioral phenotypes
Abstract
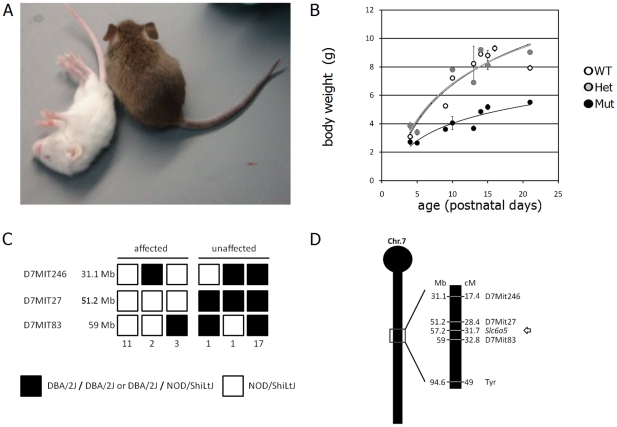
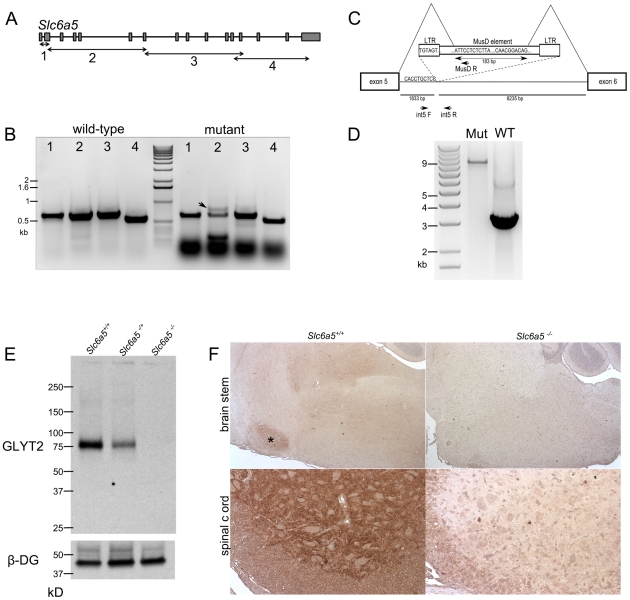
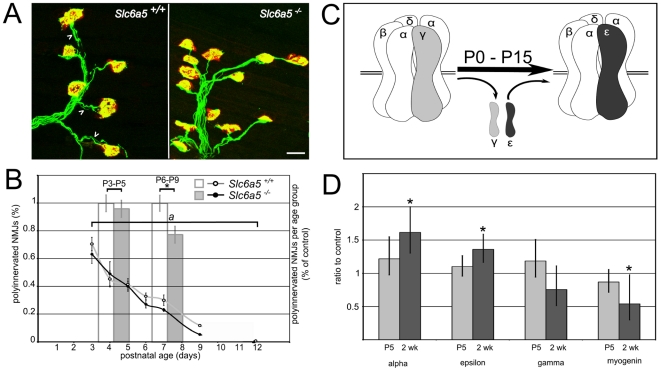
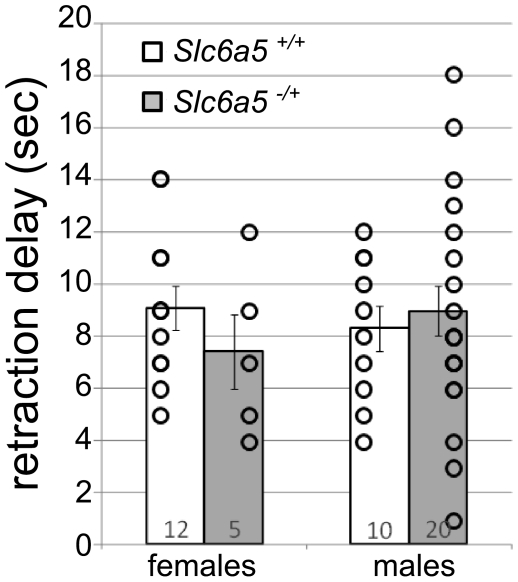
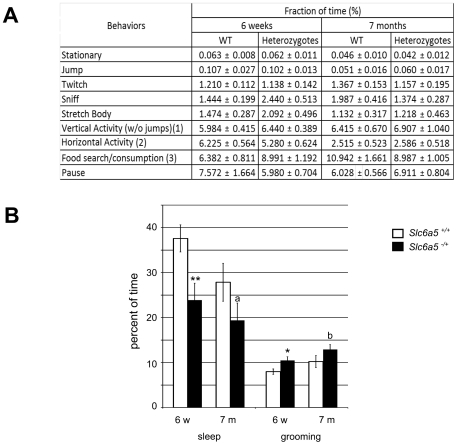
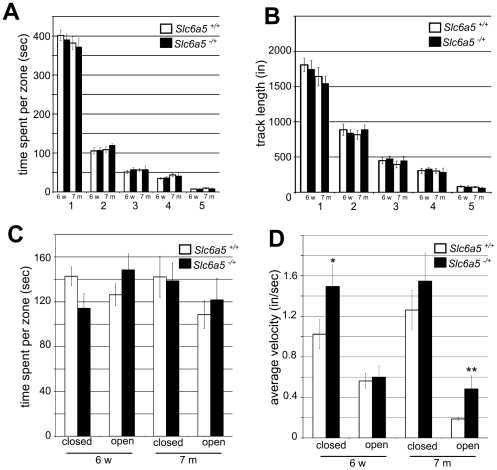
Glycine is the major inhibitory neurotransmitter in the spinal cord and some brain regions. The presynaptic glycine transporter, GlyT2, is required for sustained glycinergic transmission through presynaptic reuptake and recycling of glycine. Mutations in SLC6A5, encoding GlyT2, cause hereditary hyperekplexia in humans, and similar phenotypes in knock-out mice, and variants are associated with schizophrenia. We identified a spontaneous mutation in mouse Slc6a5, caused by a MusD retrotransposon insertion. The GlyT2 protein is undetectable in homozygous mutants, indicating a null allele. Homozygous mutant mice are normal at birth, but develop handling-induced spasms at five days of age, and only survive for two weeks, but allow the study of early activity-regulated developmental processes. At the neuromuscular junction, synapse elimination and the switch from embryonic to adult acetylcholine receptor subunits are hastened, consistent with a presumed increase in motor neuron activity, and transcription of acetylcholine receptors is elevated. Heterozygous mice, which show no reduction in lifespan but nonetheless have reduced levels of GlyT2, have a normal thermal sensitivity with the hot-plate test, but differences in repetitive grooming and decreased sleep time with home-cage monitoring. Open-field and elevated plus-maze tests did not detect anxiety-like behaviors; however, the latter showed a hyperactivity phenotype. Importantly, grooming and hyperactivity are observed in mouse schizophrenia models. Thus, mutations in Slc6a5 show changes in neuromuscular junction development as homozygotes, and behavioral phenotypes as heterozygotes, indicating their usefulness for studies related to glycinergic dysfunction.
Conflict of interest statement
Figures
Similar articles
-
The glycine transporter GlyT2 controls the dynamics of synaptic vesicle refilling in inhibitory spinal cord neurons.J Neurosci. 2008 Sep 24;28(39):9755-68. doi: 10.1523/JNEUROSCI.0509-08.2008. J Neurosci. 2008. PMID: 18815261 Free PMC article.
-
Mutations in the GlyT2 gene (SLC6A5) are a second major cause of startle disease.J Biol Chem. 2012 Aug 17;287(34):28975-85. doi: 10.1074/jbc.M112.372094. Epub 2012 Jun 14. J Biol Chem. 2012. PMID: 22700964 Free PMC article. Clinical Trial.
-
Molecular basis of the dominant negative effect of a glycine transporter 2 mutation associated with hyperekplexia.J Biol Chem. 2015 Jan 23;290(4):2150-65. doi: 10.1074/jbc.M114.587055. Epub 2014 Dec 5. J Biol Chem. 2015. PMID: 25480793 Free PMC article.
-
Hyperekplexia-associated mutations in the neuronal glycine transporter 2.Neurochem Int. 2019 Feb;123:95-100. doi: 10.1016/j.neuint.2018.05.014. Epub 2018 May 30. Neurochem Int. 2019. PMID: 29859229 Review.
-
Molecular mechanisms of glycine transporter GlyT2 mutations in startle disease.Biol Chem. 2012 Apr;393(4):283-9. doi: 10.1515/BC-2011-232. Biol Chem. 2012. PMID: 22114948 Review.
Cited by
-
MHCI promotes developmental synapse elimination and aging-related synapse loss at the vertebrate neuromuscular junction.Brain Behav Immun. 2016 Aug;56:197-208. doi: 10.1016/j.bbi.2016.01.008. Epub 2016 Jan 21. Brain Behav Immun. 2016. PMID: 26802986 Free PMC article.
-
Inhibition of Glycine Re-Uptake: A Potential Approach for Treating Pain by Augmenting Glycine-Mediated Spinal Neurotransmission and Blunting Central Nociceptive Signaling.Biomolecules. 2021 Jun 10;11(6):864. doi: 10.3390/biom11060864. Biomolecules. 2021. PMID: 34200954 Free PMC article. Review.
-
The postnatal development of ultrasonic vocalization-associated breathing is altered in glycine transporter 2-deficient mice.J Physiol. 2019 Jan;597(1):173-191. doi: 10.1113/JP276976. Epub 2018 Nov 20. J Physiol. 2019. PMID: 30296333 Free PMC article.
-
Mouse germ line mutations due to retrotransposon insertions.Mob DNA. 2019 Apr 13;10:15. doi: 10.1186/s13100-019-0157-4. eCollection 2019. Mob DNA. 2019. PMID: 31011371 Free PMC article. Review.
-
Noninvasive, High-throughput Determination of Sleep Duration in Rodents.J Vis Exp. 2018 Apr 18;(134):57420. doi: 10.3791/57420. J Vis Exp. 2018. PMID: 29733321 Free PMC article.
References
-
- Ornung G, Ottersen OP, Cullheim S, Ulfhake B. Distribution of glutamate-, glycine- and GABA-immunoreactive nerve terminals on dendrites in the cat spinal motor nucleus. Exp Brain Res. 1998;118:517–532. - PubMed
-
- Renshaw B. Central effects of centripetal impulses in axons of spinal ventral roots. J Neurophysiol. 1946;9:191–204. - PubMed
Publication types
MeSH terms
Substances
Grants and funding
LinkOut - more resources
Full Text Sources
Molecular Biology Databases
