

Multiplex detection and SNP genotyping in a single fluorescence channel
- PMID: 22272339
- PMCID: PMC3260291
- DOI: 10.1371/journal.pone.0030340
Multiplex detection and SNP genotyping in a single fluorescence channel
Abstract
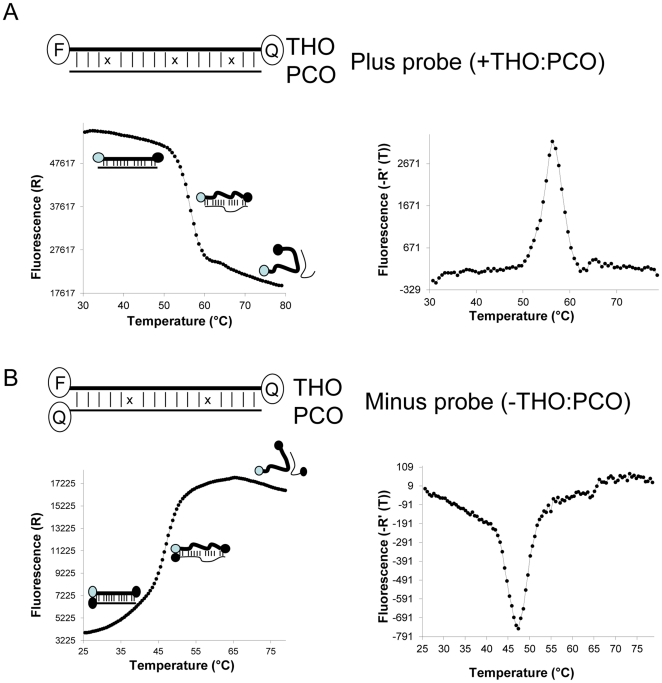
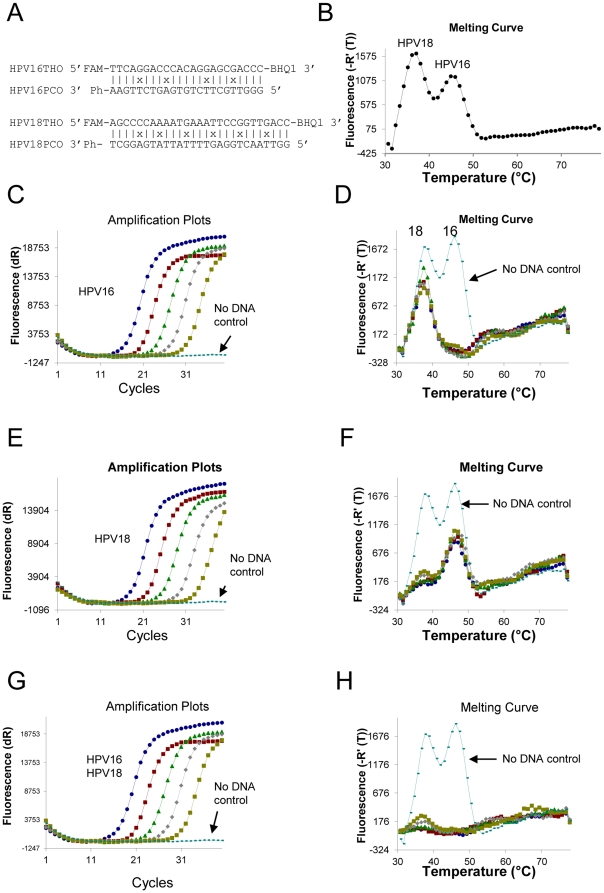
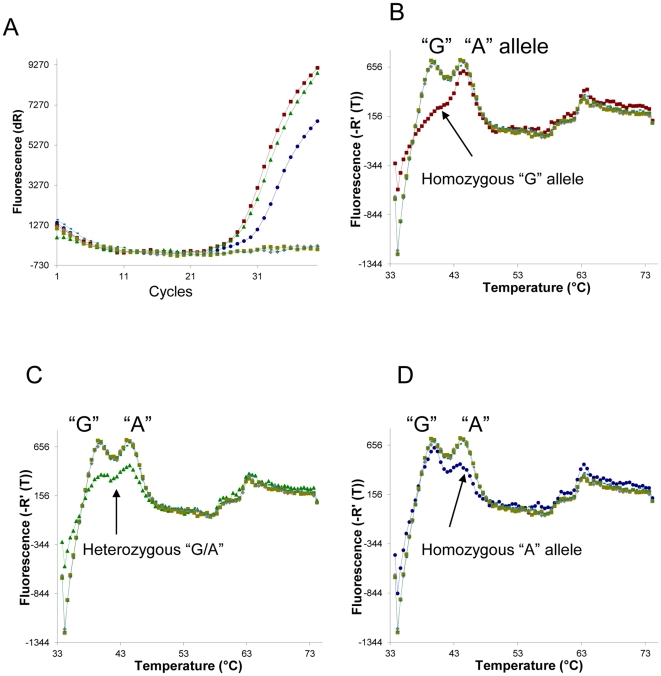
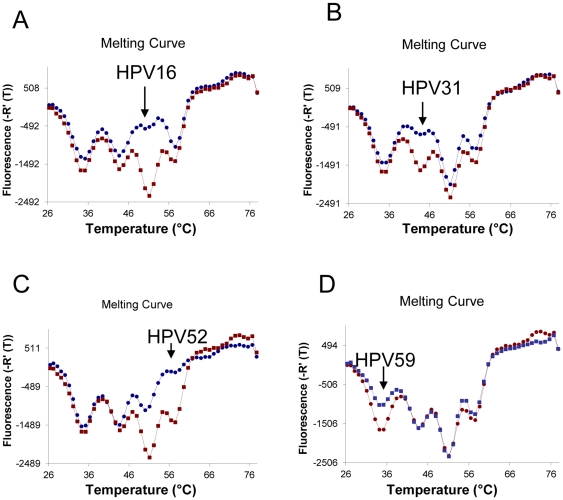
Probe-based PCR is widely used for SNP (single nucleotide polymorphism) genotyping and pathogen nucleic acid detection due to its simplicity, sensitivity and cost-effectiveness. However, the multiplex capability of hydrolysis probe-based PCR is normally limited to one target (pathogen or allele) per fluorescence channel. Current fluorescence PCR machines typically have 4-6 channels. We present a strategy permitting the multiplex detection of multiple targets in a single detection channel. The technique is named Multiplex Probe Amplification (MPA). Polymorphisms of the CYP2C9 gene (cytochrome P450, family 2, subfamily C, polypeptide 9, CYP2C9*2) and human papillomavirus sequences HPV16, 18, 31, 52 and 59 were chosen as model targets for testing MPA. The allele status of the CYP2C9*2 determined by MPA was entirely concordant with the reference TaqMan® SNP Genotyping Assays. The four HPV strain sequences could be independently detected in a single fluorescence detection channel. The results validate the multiplex capacity, the simplicity and accuracy of MPA for SNP genotyping and multiplex detection using different probes labeled with the same fluorophore. The technique offers a new way to multiplex in a single detection channel of a closed-tube PCR.
Conflict of interest statement
Figures
Similar articles
-
Rapid single-nucleotide polymorphism detection of cytochrome P450 (CYP2C9) and vitamin K epoxide reductase (VKORC1) genes for the warfarin dose adjustment by the SMart-amplification process version 2.Clin Chem. 2009 Apr;55(4):804-12. doi: 10.1373/clinchem.2008.115295. Epub 2009 Jan 30. Clin Chem. 2009. PMID: 19181737
-
Rationally Designed Universal Melting Probes (Uni-Melt) for Multiplex Genotyping.Anal Chem. 2024 Dec 10;96(49):19312-19320. doi: 10.1021/acs.analchem.4c03050. Epub 2024 Nov 26. Anal Chem. 2024. PMID: 39600140
-
Self-primed isothermal amplification for genomic DNA detection of human papillomavirus.Biosens Bioelectron. 2017 Apr 15;90:258-263. doi: 10.1016/j.bios.2016.10.024. Epub 2016 Oct 10. Biosens Bioelectron. 2017. PMID: 27915180
-
HPV detection methods and genotyping techniques in screening for cervical cancer.Ann Pathol. 2012 Dec;32(6):e15-23, 401-9. doi: 10.1016/j.annpat.2012.09.231. Epub 2012 Nov 22. Ann Pathol. 2012. PMID: 23244480 Review. English, French.
-
Current methods for fluorescence-based universal sequence-dependent detection of nucleic acids in homogenous assays and clinical applications.Clin Chem. 2013 Nov;59(11):1567-82. doi: 10.1373/clinchem.2013.205211. Epub 2013 Aug 12. Clin Chem. 2013. PMID: 23938456 Review.
Cited by
-
Single-tube, dual channel pentaplexing for the identification of Candida strains associated with human infection.Sci Rep. 2019 Oct 11;9(1):14692. doi: 10.1038/s41598-019-51198-6. Sci Rep. 2019. PMID: 31604994 Free PMC article.
-
Multiplex detection of eight different viral enteropathogens in clinical samples, combining RT-PCR technology with melting curve analysis.Virol J. 2022 Apr 7;19(1):61. doi: 10.1186/s12985-022-01789-z. Virol J. 2022. PMID: 35392937 Free PMC article.
-
Clinical Evaluation of a Multiplex PCR Assay for Simultaneous Detection of 18 Respiratory Pathogens in Patients with Acute Respiratory Infections.Pathogens. 2022 Dec 23;12(1):21. doi: 10.3390/pathogens12010021. Pathogens. 2022. PMID: 36678368 Free PMC article.
-
Nanoluciferase Reporter Mycobacteriophage for Sensitive and Rapid Detection of Mycobacterium tuberculosis Drug Susceptibility.J Bacteriol. 2020 Oct 22;202(22):e00411-20. doi: 10.1128/JB.00411-20. Print 2020 Oct 22. J Bacteriol. 2020. PMID: 32900827 Free PMC article.
-
Analysis of the epidemiological situation of influenza in Guangzhou under the prevention and control of COVID-19 in June 2022.Clin Respir J. 2024 May;18(5):e13754. doi: 10.1111/crj.13754. Clin Respir J. 2024. PMID: 38693702 Free PMC article.
References
-
- Mackay IM. Real-time PCR in the microbiology laboratory. Clin Microbiol Infect. 2004;10:190–212. - PubMed
-
- Yeh HY, Yates MV, Chen W, Mulchandani A. Real-time molecular methods to detect infectious viruses. Semin Cell Dev Biol. 2009;20:49–54. - PubMed
-
- Edwards MC, Gibbs RA. Multiplex PCR: advantages, development, and applications. PCR Methods Appl. 1994;3:S65–75. - PubMed
Publication types
MeSH terms
Substances
LinkOut - more resources
Full Text Sources
Other Literature Sources
