

Lowly expressed ribosomal protein s19 in the feces of patients with colorectal cancer
- PMID: 22272377
- PMCID: PMC3261477
- DOI: 10.5402/2012/394545
Lowly expressed ribosomal protein s19 in the feces of patients with colorectal cancer
Abstract
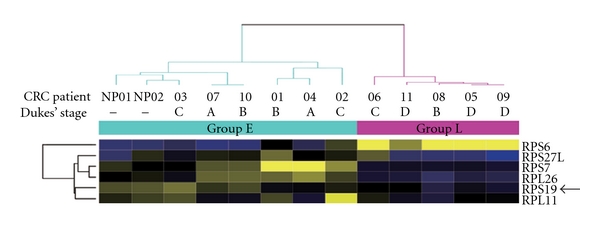
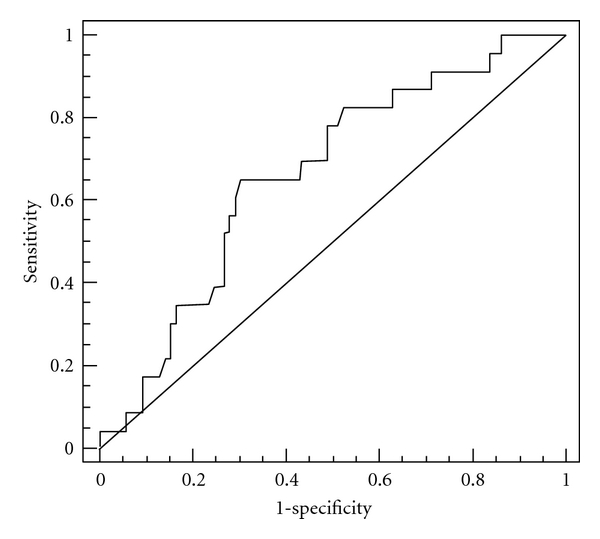
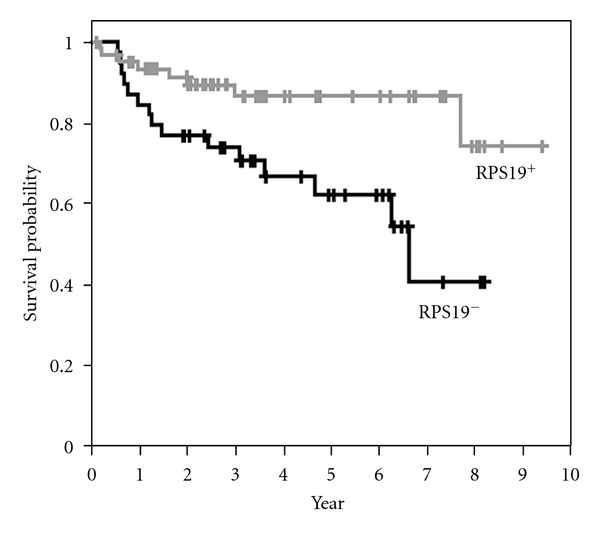
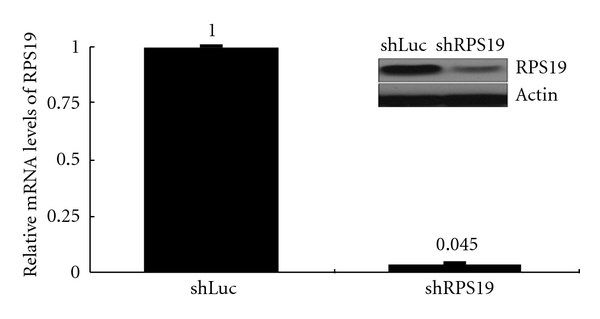
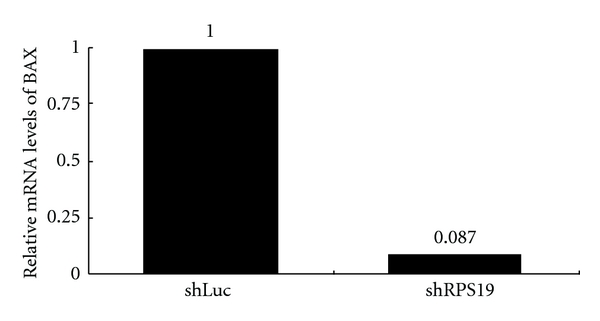
Colorectal cancer (CRC) has become one of the most common fatal cancers. CRC tumorigenesis is a complex process involving multiple genetic changes to several sequential mutations or molecular alterations. P53 is one of the most significant genes; its mutations account for more than half of all CRC. Therefore, understanding the cellular genes that are directly or indirectly related to p53 is particularly crucial for investigating CRC tumorigenesis. In this study, a p53-related ribosomal protein, ribosomal protein S19 (RPS19), obtained from the feces of CRC patients is evaluated by using specifically quantitative real-time PCR and knocked down in the colonic cell line by gene silencing. This study found that CRC patients with higher expressions of RPS19 in their feces had a better prognosis and consistent expressions of RPS19 and BAX in their colonic cells. In conclusion, the potential mechanism of RPS19 in CRC possibly involves cellular apoptosis through the BAX/p53 pathway, and the levels of fecal RPS19 may function as a prognostic predictor for CRC patients.
Figures
Similar articles
-
Ribosomal protein S19 deficiency leads to reduced proliferation and increased apoptosis but does not affect terminal erythroid differentiation in a cell line model of Diamond-Blackfan anemia.Stem Cells. 2008 Feb;26(2):323-9. doi: 10.1634/stemcells.2007-0569. Epub 2007 Oct 25. Stem Cells. 2008. PMID: 17962699
-
LUCAT1 promotes colorectal cancer tumorigenesis by targeting the ribosomal protein L40-MDM2-p53 pathway through binding with UBA52.Cancer Sci. 2019 Apr;110(4):1194-1207. doi: 10.1111/cas.13951. Epub 2019 Feb 28. Cancer Sci. 2019. PMID: 30690837 Free PMC article.
-
SiRNA-mediated Silencing of the RPS19 Gene Induces Apoptosis and Inhibits Cell Cycle Progression in Chronic Myeloid Leukemia Cells.Int J Mol Cell Med. 2024;13(4):436-447. doi: 10.22088/IJMCM.BUMS.13.4.436. Int J Mol Cell Med. 2024. PMID: 39895916 Free PMC article.
-
Faecal ribosomal protein L19 is a genetic prognostic factor for survival in colorectal cancer.J Cell Mol Med. 2008 Oct;12(5B):1936-43. doi: 10.1111/j.1582-4934.2008.00253.x. Epub 2008 Feb 4. J Cell Mol Med. 2008. PMID: 18266979 Free PMC article.
-
Epigenetic Alterations Upstream and Downstream of p53 Signaling in Colorectal Carcinoma.Cancers (Basel). 2021 Aug 13;13(16):4072. doi: 10.3390/cancers13164072. Cancers (Basel). 2021. PMID: 34439227 Free PMC article. Review.
Cited by
-
Small ribosomal protein subunit S7 suppresses ovarian tumorigenesis through regulation of the PI3K/AKT and MAPK pathways.PLoS One. 2013 Nov 11;8(11):e79117. doi: 10.1371/journal.pone.0079117. eCollection 2013. PLoS One. 2013. PMID: 24244431 Free PMC article.
-
The Ribosomal Protein S19 Suppresses Antitumor Immune Responses via the Complement C5a Receptor 1.J Immunol. 2017 Apr 1;198(7):2989-2999. doi: 10.4049/jimmunol.1602057. Epub 2017 Feb 22. J Immunol. 2017. PMID: 28228558 Free PMC article.
-
Bioinformatics Analysis Reveals the Potential Diagnostic Biomarkers for Abdominal Aortic Aneurysm.Front Cardiovasc Med. 2021 Jul 20;8:656263. doi: 10.3389/fcvm.2021.656263. eCollection 2021. Front Cardiovasc Med. 2021. PMID: 34355024 Free PMC article.
-
High Ran level is correlated with poor prognosis in patients with colorectal cancer.Int J Clin Oncol. 2013 Oct;18(5):856-63. doi: 10.1007/s10147-012-0465-x. Epub 2012 Sep 6. Int J Clin Oncol. 2013. PMID: 22956174
-
Atovaquone Suppresses Triple-Negative Breast Tumor Growth by Reducing Immune-Suppressive Cells.Int J Mol Sci. 2021 May 13;22(10):5150. doi: 10.3390/ijms22105150. Int J Mol Sci. 2021. PMID: 34068008 Free PMC article.
References
-
- Jemal A, Siegel R, Ward E, Hao Y, Xu J, Thun MJ. Cancer statistics, 2009. CA Cancer Journal for Clinicians. 2009;59(4):225–249. - PubMed
-
- Bardelli A, Velculescu VE. Mutational analysis of gene families in human cancer. Current Opinion in Genetics and Development. 2005;15(1):5–12. - PubMed
-
- Rozen P. Cancer of the gastrointestinal tract: early detection or early prevention? European Journal of Cancer Prevention. 2004;13(1):71–75. - PubMed
-
- Vogelstein B, Fearon ER, Hamilton SR, et al. Genetic alterations during colorectal-tumor development. New England Journal of Medicine. 1988;319(9):525–532. - PubMed
LinkOut - more resources
Full Text Sources
Research Materials
Miscellaneous
