

Regional and cell-type-specific effects of DAMGO on striatal D1 and D2 dopamine receptor-expressing medium-sized spiny neurons
- PMID: 22273000
- PMCID: PMC3297119
- DOI: 10.1042/AN20110063
Regional and cell-type-specific effects of DAMGO on striatal D1 and D2 dopamine receptor-expressing medium-sized spiny neurons
Abstract
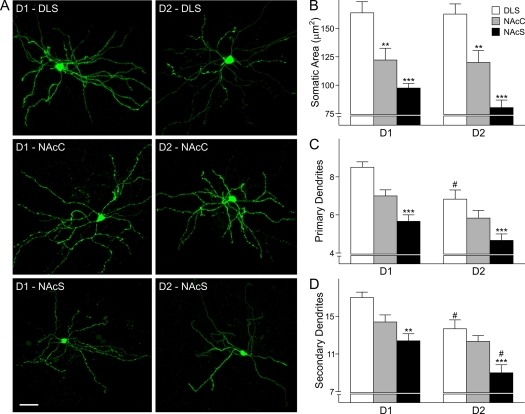
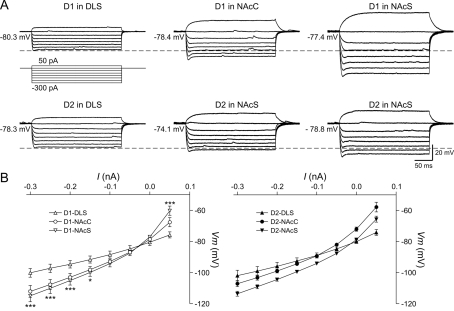
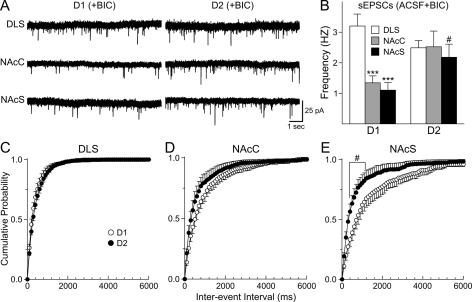
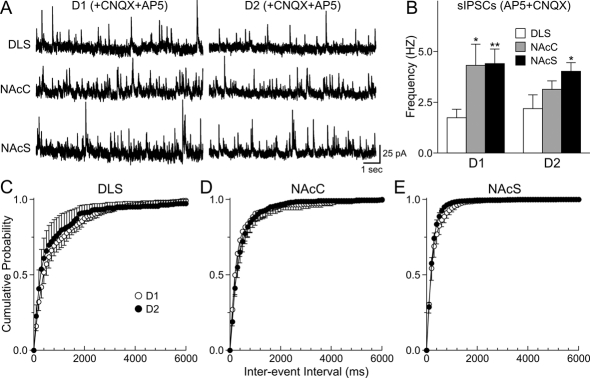
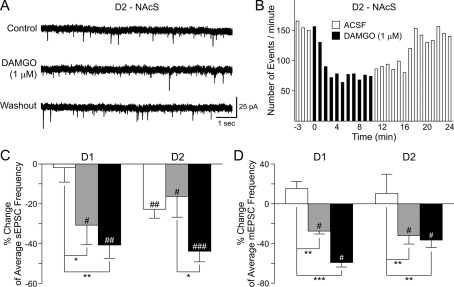
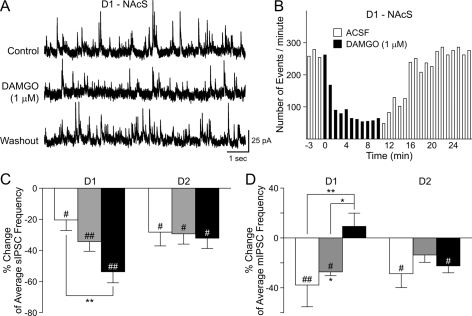
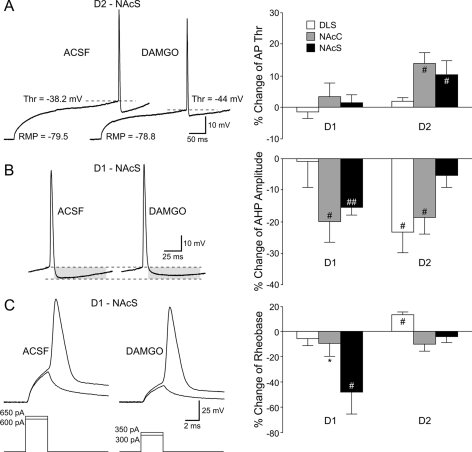
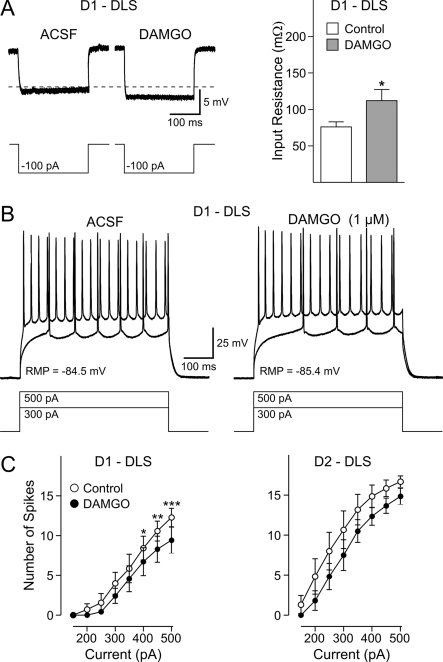
The striatum can be divided into the DLS (dorsolateral striatum) and the VMS (ventromedial striatum), which includes NAcC (nucleus accumbens core) and NAcS (nucleus accumbens shell). Here, we examined differences in electrophysiological properties of MSSNs (medium-sized spiny neurons) based on their location, expression of DA (dopamine) D1/D2 receptors and responses to the μ-opioid receptor agonist, DAMGO {[D-Ala(2)-MePhe(4)-Gly(ol)(5)]enkephalin}. The main differences in morphological and biophysical membrane properties occurred among striatal sub-regions. MSSNs in the DLS were larger, had higher membrane capacitances and lower Rin (input resistances) compared with cells in the VMS. RMPs (resting membrane potentials) were similar among regions except for D2 cells in the NAcC, which displayed a significantly more depolarized RMP. In contrast, differences in frequency of spontaneous excitatory synaptic inputs were more prominent between cell types, with D2 cells receiving significantly more excitatory inputs than D1 cells, particularly in the VMS. Inhibitory inputs were not different between D1 and D2 cells. However, MSSNs in the VMS received more inhibitory inputs than those in the DLS. Acute application of DAMGO reduced the frequency of spontaneous excitatory and inhibitory postsynaptic currents, but the effect was greater in the VMS, in particular in the NAcS, where excitatory currents from D2 cells and inhibitory currents from D1 cells were inhibited by the largest amount. DAMGO also increased cellular excitability in the VMS, as shown by reduced threshold for evoking APs (action potentials). Together the present findings help elucidate the regional and cell-type-specific substrate of opioid actions in the striatum and point to the VMS as a critical mediator of DAMGO effects.
Keywords: ACSF, artificial cerebrospinal fluid; AHP, after hyperpolarization; AP, action potential; AP-5, dl-2-amino-5-phosphonovaleric acid; BIC, bicuculline; CNQX, 6-cyano-7-nitroquinoxaline-2,3-dione; CsMeth, Cs-methanesulfonate; D1/D2 receptors; DA, dopamine; DAMGO, [d-Ala2-MePhe4-Gly(ol)5]enkephalin; DLS, dorsolateral striatum; EGFP, enhanced green fluorescent protein; EPSC, excitatory postsynaptic current; IPSC, inhibitory postsynaptic current; KGluc, K-gluconate; MSSN, medium-sized spiny neuron; NAcC, nucleus accumbens core; NAcS, nucleus accumbens shell; RMP, resting membrane potential; Rin, input resistance; TBST, TBS containing 0.1% Tween 20; TTX, tetrodotoxin; UCLA, University of California at Los Angeles; VMS, ventromedial striatum; VTA, ventral tegmental area; electrophysiology; mEPSC, miniature EPSC; mIPSC, miniature IPSC; nucleus accumbens; opioid receptors; sEPSC, spontaneous EPSC; sIPSC, spontaneous IPSC; striatum.
Figures
Similar articles
-
Differential electrophysiological properties of dopamine D1 and D2 receptor-containing striatal medium-sized spiny neurons.Eur J Neurosci. 2008 Feb;27(3):671-82. doi: 10.1111/j.1460-9568.2008.06038.x. Eur J Neurosci. 2008. PMID: 18279319
-
Dopamine modulation of excitatory currents in the striatum is dictated by the expression of D1 or D2 receptors and modified by endocannabinoids.Eur J Neurosci. 2010 Jan;31(1):14-28. doi: 10.1111/j.1460-9568.2009.07047.x. Epub 2009 Dec 21. Eur J Neurosci. 2010. PMID: 20092552
-
Activation of mu-opioid receptors excites a population of locus coeruleus-spinal neurons through presynaptic disinhibition.Brain Res. 2004 Jan 30;997(1):67-78. doi: 10.1016/j.brainres.2003.10.050. Brain Res. 2004. PMID: 14715151
-
Licking microstructure in response to novel rewards, reward devaluation and dopamine antagonists: Possible role of D1 and D2 medium spiny neurons in the nucleus accumbens.Neurosci Biobehav Rev. 2024 Oct;165:105861. doi: 10.1016/j.neubiorev.2024.105861. Epub 2024 Aug 17. Neurosci Biobehav Rev. 2024. PMID: 39159734 Review.
-
Striatal D2: Where habits and newly learned actions meet.Learn Behav. 2022 Sep;50(3):267-268. doi: 10.3758/s13420-022-00526-4. Epub 2022 May 26. Learn Behav. 2022. PMID: 35618985 Review.
Cited by
-
Dissociable effects of oxycodone on behavior, calcium transient activity, and excitability of dorsolateral striatal neurons.Front Neural Circuits. 2022 Oct 26;16:983323. doi: 10.3389/fncir.2022.983323. eCollection 2022. Front Neural Circuits. 2022. PMID: 36389179 Free PMC article.
-
Differential alterations of insular cortex excitability after adolescent or adult chronic intermittent ethanol administration in male rats.J Neurosci Res. 2021 Feb;99(2):649-661. doi: 10.1002/jnr.24737. Epub 2020 Oct 22. J Neurosci Res. 2021. PMID: 33094531 Free PMC article.
-
Transient Prepubertal Mifepristone Treatment Normalizes Deficits in Contextual Memory and Neuronal Activity of Adult Male Rats Exposed to Maternal Deprivation.eNeuro. 2017 Nov 2;4(5):ENEURO.0253-17.2017. doi: 10.1523/ENEURO.0253-17.2017. eCollection 2017 Sep-Oct. eNeuro. 2017. PMID: 29098176 Free PMC article.
-
Limited versus extended cocaine intravenous self-administration: Behavioral effects and electrophysiological changes in insular cortex.CNS Neurosci Ther. 2021 Feb;27(2):196-205. doi: 10.1111/cns.13469. Epub 2020 Oct 29. CNS Neurosci Ther. 2021. PMID: 33118700 Free PMC article.
-
Differential Patterns of Synaptic Plasticity in the Nucleus Accumbens Caused by Continuous and Interrupted Morphine Exposure.J Neurosci. 2023 Jan 11;43(2):308-318. doi: 10.1523/JNEUROSCI.0595-22.2022. Epub 2022 Nov 17. J Neurosci. 2023. PMID: 36396404 Free PMC article.
References
-
- André VM, Cepeda C, Cummings DM, Jocoy EL, Fisher YE, William Yang X, Levine MS. Dopamine modulation of excitatory currents in the striatum is dictated by the expression of D1 or D2 receptors and modified by endocannabinoids. Eur J Neurosci. 2010;31:14–28. - PubMed
-
- Cepeda C, Andre VM, Yamazaki I, Wu N, Kleiman-Weiner M, Levine MS. Differential electrophysiological properties of dopamine D1 and D2 receptor-containing striatal medium-sized spiny neurons. Eur J Neurosci. 2008;27:671–682. - PubMed
-
- Day M, Wang Z, Ding J, An X, Ingham CA, Shering AF, Wokosin D, Ilijic E, Sun Z, Sampson AR, Mugnaini E, Deutch AY, Sesack SR, Arbuthnott GW, Surmeier DJ. Selective elimination of glutamatergic synapses on striatopallidal neurons in Parkinson disease models. Nat Neurosci. 2006;9:251–259. - PubMed
Publication types
MeSH terms
Substances
Grants and funding
LinkOut - more resources
Full Text Sources
Molecular Biology Databases
Research Materials
Miscellaneous
