

Taking advantage of the strengths of 2 different dietary assessment instruments to improve intake estimates for nutritional epidemiology
- PMID: 22273536
- PMCID: PMC3271815
- DOI: 10.1093/aje/kwr317
Taking advantage of the strengths of 2 different dietary assessment instruments to improve intake estimates for nutritional epidemiology
Abstract
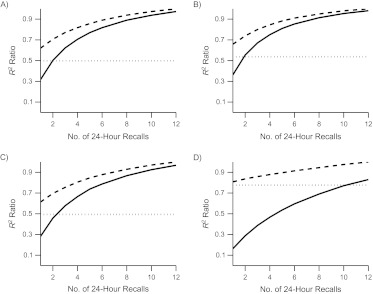
With the advent of Internet-based 24-hour recall (24HR) instruments, it is now possible to envision their use in cohort studies investigating the relation between nutrition and disease. Understanding that all dietary assessment instruments are subject to measurement errors and correcting for them under the assumption that the 24HR is unbiased for usual intake, here the authors simultaneously address precision, power, and sample size under the following 3 conditions: 1) 1-12 24HRs; 2) a single calibrated food frequency questionnaire (FFQ); and 3) a combination of 24HR and FFQ data. Using data from the Eating at America's Table Study (1997-1998), the authors found that 4-6 administrations of the 24HR is optimal for most nutrients and food groups and that combined use of multiple 24HR and FFQ data sometimes provides data superior to use of either method alone, especially for foods that are not regularly consumed. For all food groups but the most rarely consumed, use of 2-4 recalls alone, with or without additional FFQ data, was superior to use of FFQ data alone. Thus, if self-administered automated 24HRs are to be used in cohort studies, 4-6 administrations of the 24HR should be considered along with administration of an FFQ.
Figures


References
-
- Subar AF, Kipnis V, Troiano RP, et al. Using intake biomarkers to evaluate the extent of dietary misreporting in a large sample of adults: The OPEN Study. Am J Epidemiol. 2003;158(1):1–13. - PubMed
-
- Kipnis V, Subar AF, Midthune D, et al. Structure of dietary measurement error: results of the OPEN biomarker study. Am J Epidemiol. 2003;158(1):14–21. - PubMed
-
- Neuhouser ML, Tinker L, Shaw PA, et al. Use of recovery biomarkers to calibrate nutrient consumption self-reports in the Women’s Health Initiative. Am J Epidemiol. 2008;167(10):1247–1259. - PubMed
-
- Schatzkin A, Kipnis V, Carroll RJ, et al. A comparison of a food frequency questionnaire with a 24-hour recall for use in an epidemiological cohort study: results from the biomarker-based Observing Protein and Energy Nutrition (OPEN) Study. Int J Epidemiol. 2003;32(6):1054–1062. - PubMed
Publication types
MeSH terms
Grants and funding
LinkOut - more resources
Full Text Sources
Molecular Biology Databases
