Lack of indinavir effects on methadone disposition despite inhibition of hepatic and intestinal cytochrome P4503A (CYP3A)
- PMID: 22273859
- PMCID: PMC3586934
- DOI: 10.1097/ALN.0b013e3182423478
Lack of indinavir effects on methadone disposition despite inhibition of hepatic and intestinal cytochrome P4503A (CYP3A)
Abstract
Background: Methadone disposition and pharmacodynamics are highly susceptible to interactions with antiretroviral drugs. Methadone clearance and drug interactions have been attributed to cytochrome P4503A4 (CYP3A4), but actual mechanisms are unknown. Drug interactions can be clinically and mechanistically informative. This investigation assessed effects of the protease inhibitor indinavir on methadone pharmacokinetics and pharmacodynamics, hepatic and intestinal CYP3A4/5 activity (using alfentanil), and intestinal transporter activity (using fexofenadine).
Methods: Twelve healthy volunteers underwent a sequential crossover. On three consecutive days they received oral alfentanil plus fexofenadine, intravenous alfentanil, and intravenous plus oral (deuterium-labeled) methadone. This was repeated after 2 weeks of indinavir. Plasma and urine analytes were measured by mass spectrometry. Opioid effects were measured by miosis.
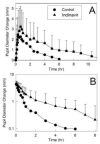
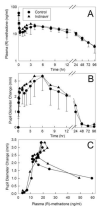
Results: Indinavir significantly inhibited hepatic and first-pass CYP3A activity. Intravenous alfentanil systemic clearance and hepatic extraction were reduced to 40-50% of control, apparent oral clearance to 30% of control, and intestinal extraction decreased by half, indicating 50% and 70% inhibition of hepatic and first-pass CYP3A activity. Indinavir increased fexofenadine area under the plasma concentration-time curve 3-fold, suggesting significant P-glycoprotein inhibition. Indinavir had no significant effects on methadone plasma concentrations, methadone N-demethylation, systemic or apparent oral clearance, renal clearance, hepatic extraction or clearance, or bioavailability. Methadone plasma concentration-effect relationships were unaffected by indinavir.
Conclusions: Despite significant inhibition of hepatic and intestinal CYP3A activity, indinavir had no effect on methadone N-demethylation and clearance, suggesting little or no role for CYP3A in clinical disposition of single-dose methadone. Inhibition of gastrointestinal transporter activity had no influence of methadone bioavailability.
Figures


Similar articles
-
Cytochrome P4503A does not mediate the interaction between methadone and ritonavir-lopinavir.Drug Metab Dispos. 2013 Dec;41(12):2166-74. doi: 10.1124/dmd.113.053991. Epub 2013 Sep 25. Drug Metab Dispos. 2013. PMID: 24067429 Free PMC article.
-
Methadone pharmacokinetics are independent of cytochrome P4503A (CYP3A) activity and gastrointestinal drug transport: insights from methadone interactions with ritonavir/indinavir.Anesthesiology. 2009 Mar;110(3):660-72. doi: 10.1097/ALN.0b013e3181986a9a. Anesthesiology. 2009. PMID: 19225389 Free PMC article.
-
Methadone metabolism and clearance are induced by nelfinavir despite inhibition of cytochrome P4503A (CYP3A) activity.Drug Alcohol Depend. 2009 May 1;101(3):158-68. doi: 10.1016/j.drugalcdep.2008.12.009. Epub 2009 Feb 18. Drug Alcohol Depend. 2009. PMID: 19232844 Free PMC article.
-
Mechanism of ritonavir changes in methadone pharmacokinetics and pharmacodynamics: II. Ritonavir effects on CYP3A and P-glycoprotein activities.Clin Pharmacol Ther. 2008 Oct;84(4):506-12. doi: 10.1038/clpt.2008.102. Clin Pharmacol Ther. 2008. PMID: 19238656 Free PMC article. Clinical Trial.
-
Lopinavir/ritonavir: a review of its use in the management of HIV infection.Drugs. 2003;63(8):769-802. doi: 10.2165/00003495-200363080-00004. Drugs. 2003. PMID: 12662125 Review.
Cited by
-
Drug-Drug Interaction Studies of Esmethadone (REL-1017) Involving CYP3A4- and CYP2D6-Mediated Metabolism.Drugs R D. 2024 Mar;24(1):51-68. doi: 10.1007/s40268-023-00450-6. Epub 2023 Nov 27. Drugs R D. 2024. PMID: 38010591 Free PMC article. Clinical Trial.
-
Pharmacokinetic Effects of Isavuconazole Coadministration With the Cytochrome P450 Enzyme Substrates Bupropion, Repaglinide, Caffeine, Dextromethorphan, and Methadone in Healthy Subjects.Clin Pharmacol Drug Dev. 2017 Jan;6(1):54-65. doi: 10.1002/cpdd.281. Epub 2016 Jul 15. Clin Pharmacol Drug Dev. 2017. PMID: 27273149 Free PMC article. Clinical Trial.
-
Cytochrome P4503A does not mediate the interaction between methadone and ritonavir-lopinavir.Drug Metab Dispos. 2013 Dec;41(12):2166-74. doi: 10.1124/dmd.113.053991. Epub 2013 Sep 25. Drug Metab Dispos. 2013. PMID: 24067429 Free PMC article.
-
A review of significant pharmacokinetic drug interactions with antidepressants and their management.Ment Health Clin. 2016 Mar 8;6(1):35-41. doi: 10.9740/mhc.2016.01.035. eCollection 2016 Jan. Ment Health Clin. 2016. PMID: 29955445 Free PMC article. Review.
-
Current Concepts in Methadone Metabolism and Transport.Clin Pharmacol Drug Dev. 2017 Mar;6(2):125-134. doi: 10.1002/cpdd.326. Clin Pharmacol Drug Dev. 2017. PMID: 28263461 Free PMC article.
References
-
- Nicholson AB. Methadone for cancer pain. Cochrane Database Syst Rev. 2007:CD003971. - PubMed
-
- Chou R, Fanciullo GJ, Fine PG, Adler JA, Ballantyne JC, Davies P, Donovan MI, Fishbain DA, Foley KM, Fudin J, Gilson AM, Kelter A, Mauskop A, O’Connor PG, Passik SD, Pasternak GW, Portenoy RK, Rich BA, Roberts RG, Todd KH, Miaskowski C. Clinical guidelines for the use of chronic opioid therapy in chronic noncancer pain. J Pain. 2009;10:113–30. - PMC - PubMed
-
- Lobmaier P, Gossop M, Waal H, Bramness J. The pharmacological treatment of opioid addiction--A clinical perspective. Eur J Clin Pharmacol. 2010;66:537–45. - PubMed
-
- Clark JD. Understanding methadone metabolism: A foundation for safer use. Anesthesiology. 2008;108:351–2. - PubMed
Publication types
MeSH terms
Substances
Grants and funding
LinkOut - more resources
Full Text Sources

